Cisco Spaces Occupancy Runbook (Cisco Validated)
OVERVIEW
This Occupancy runbook is meant to be the source of truth for all outcomes involving occupancy, regardless of technology. Rather than have multiple guides that are separated out by wireless, collab, or any other technologies, this guide is focused on customer outcomes.
The runbook begins with methods and means to get support for the features ranging from proof of value, free trial customers, paid customers, as well as onboarding activities.
Section 2 contains general requirements that are a set of standards that should be deployed in most situations. Items such as the Location Hierarchy and maps should be consistent not only for occupancy outcomes but for all outcomes.
Occupancy has varying levels of definition. Some customers are looking for just campus, building, or even floor level. Others may want room level outcomes. Some may want all levels. Section 3 is organized to get the specific requirements needed for any level of outcome the use case calls for.
Finalizing the runbook are two sections. First one contains caveats and tips which is meant to organize information throughout the runbook and beyond to provide recommendations and pitfalls to avoid. The last section contains the FAQ which will have commonly asked questions with answers provided.
Support & Onboarding Info
Please follow the link below to find out about the different ways to get support for Cisco Spaces.
PREREQUISITES
Spaces OS
This Cisco Validated runbook is designed only as a follow on from the Spaces OS Runbook. It is the base installation for Cisco Spaces and is a prerequisite for this outcome. Please refer to the Spaces OS runbook for guidance on fulfilling this requirement.
OCCUPANCY APPS & OVERVIEW
Overview
Cisco Spaces occupancy outcomes can provide real-time and accurate occupancy data. These outcomes utilize advanced technologies such as sensors, beacons, or Wi-Fi and provides accurate and reliable data.
Occupancy outcomes can be acquired at various levels of the location hierarchy. The hierarchy in Cisco Spaces is as follows:
Organization
Campus
Building
Floor
Zone
Room
Desk
Details of these differences, requirements, and applications will be provided in the subsequent sections.
App/Technology Dependency Matrix
| Right Now | Location Analytics | Behavior Metrics | Space Manager | Space Utilization | Detect & Locate |
|---|---|---|---|---|---|---|
Campus |  | | |
| |
|
Building | | | |
| |
|
Floor | | | | | |  |
Zone | |  |
|
|
|
|
Room |
|
|
|  |  |
|
Desk | 
|
|
|
|
|  |
Spaces Applications
Space Utilization
Empowering real estate and facilities teams with occupancy analytics across buildings, floors, and rooms. This app helps optimize space usage, reduce real estate costs, and plan for hybrid workplace demands.
For more detailed information and/or configuration options please refer to our Configuration Guide for the Space Utilization app.
Use Cases & Value
Wireless-Based Occupancy Trends (for Campuses, Buildings, Floors, and Zones)
Capture real-time occupancy data to build up historical utilization data across your portfolio, campuses, buildings, and floors.
Value Delivered : Historical building occupancy for real estate and workplace decision making.
Useful For : Facilities, Real Estate, and Workplace teams
Room-level Utilization Trends
Combine Webex device, IoT Sensor telemetry, and calendar event data for room occupancy metrics, ghost booking rates, and more.
Value Delivered : Room booking and peak people count data combined for workplace decision making.
Useful For : Facilities, Real Estate, and Workplace teams
Right Now
Right Now provides a real time count of the number of people within a physical space & how it compares with the historical average.
For more detailed information and/or configuration options please refer to our Configuration Guide for the Right Now app.
Use Cases & Value
Active count of visitors
Count of devices/people who were spotted in the location during the last 10 minutes
Total count of visitors
Count of visitors that were present during the past ‘X’ hours (X being the threshold defined across individual verticals). For example – this could be 3 hours for Retail and 8 Hours for Workspaces
Density Trigger
It also allows users to set limits beyond which a trigger is activated. A feature that is becoming increasingly important in the post Covid world
Associated device count
‘Right Now’ app currently counts only associated devices. Associated Devices: No. of devices associating with network.
Protocol Compliance
Real time warning when the number of people at a location/sub-location exceed a previously defined threshold. Threshold could be absolute (number of people) or density (number of people per sq.ft.)
Behavior Metrics
The Behavior Metrics App enables vertical specific insights into the behavior of people within a physical space. Eg, Time spent by a shopper at a store, Time spent by employees at the workplace, frequency of visits of students to the library.
For more detailed information and/or configuration options please refer to our Configuration Guide for the Behavior Metrics app.
Use Cases & Value
Get vertical specific behavior insights
Get insights into employee, student, customer or patient behavior, entry/exit times, time spent, visit frequency etc
Benchmark performance of business locations
Compare and benchmark the performance of locations historically, against other locations within the org or with the category, industry which they operate
Understand people distribution & density
Understand trends in occupancy over different time periods and optimize space utilization based on the data
Correlate behavior data with other data sources
Run correlations with other data sources such as revenue, POS data, CRM, weather, academic performance (universities), HR outcomes (workspaces), HVAC to optimize processes. Integrate presence data with HVAC data to save energy costs
Location Analytics
The Location Analytics app enables to create various reports related to the no. of ‘visitors and visits’. Create custom widgets by filtering data based on location, date range or SSIDs.
For more detailed information and/or configuration options please refer to our Configuration Guide for the Location Analytics app.
Use Cases & Value
Create custom reports for specific business needs
Dive deeper into the data to get a granular understanding of people’s behavior. Get insights for specific locations or time periods.
Value Delivered: Improved decision making
Useful to: Operations, HR, Marketing teams
Compare people’s behavior across locations
Measure behavior of employees, customers, guests or students across different offices, campuses & floors
Value Delivered: Improved decision making
Useful to: IT teams, Operations, HR
View visitor count and visit patterns
Measure customer loyalty, student or employee engagement by understanding patterns of behavior – new vs repeat visitors. Target these segments with specific actions.
Value Delivered: Improved retention & loyalty
Useful to: HR and Admin teams, Sales & Marketing.
Understand average dwell time
Measure the impact of dwell time by correlating it with sales and revenue, employee attrition or student performance data. Make informed decisions based on this data.
Value Delivered: Increased sales, Improved student or employee productivity
Useful to: HR, Campus Faculty, Sales & Marketing
Space Manager
For more detailed information and/or configuration options please refer to our Configuration Guide for the Space Manager app.
Use Cases & Value
Experience a comprehensive overview of the workplace within a single, real-time view of floor occupancy (and with 24-hour playback). In a captivating 3D virtual environment, visualize and discover how people and things come together in indoor spaces. Identify gaps in coverage, manage new and existing IoT devices, link Wireless Access Points and Webex devices to workspaces, and much more.
Workplace Occupancy and Utilization
View real-time Floor and Room utilization
24-hour playback of occupancy heat map data
Overlay WiFi occupancy Heat Maps on Rich Maps
Real-time metrics (building, floor, room, desk)
Value Delivered: space optimization, facilities services and real estate management
Useful to: Facilities, Real Estate and IT
Room Occupancy Reports
Configure, view, and download Room Occupancy Reports for a floor or building.
Export standardized room occupancy data based on Cisco Space Digital Maps Pro to a CSV file for further analysis
Set date and time ranges to analyze specific or recurring reports
Filter room occupancy data by day of week, hour of day, room capacity, and optionally exclude empty rows with no people detected
The output CSV provides aggregated peak people count every 15, 30, or 60 minutes per room
Import into Excel, PowerBI, Tableau, or an analytics tool of choice to create custom graphs
Value Delivered: Build custom dashboards to visualize and analyze occupancy data by importing the CSV export into PowerBl, Tableau, etc., which allows users to make informed real estate and workplace decisions.
Useful to: Facilities, Real Estate and IT
Environmental Monitoring
Real-time metrics (indoor air quality, TVOCs, CO2, temperature, humidity, ambient noise, and more)
Value Delivered: Provides insights into comfort, safety, and sustainability metrics in the workplace
Useful to: Facilities, Real Estate and IT
Manage Devices
Associate Webex, Meraki and 3rd party IoT devices to Rich Map
Manage sensors – Add, Edit or Remove devices on the Workspace Management page
Manage workspace metadata (e.g.: name, type, capacity)
Value Delivered: Assign devices to workspaces and check their status with real-time information.
Useful to: Facilities, Real Estate and IT
Visualize/Find Devices
See device locations on the floorplan
Identify gaps in device coverage
Distinguish device types and data sources on Rich Maps
Value Delivered: Visualization of data sources
Useful to: Facilities, Real Estate and IT
Hierarchy for Occupancy Overview
Campus Overview
Campus level occupancy details provides a very high level of observations based on how campuses are defined in the hierarchy. This could be based on geographic locations where buildings may be clustered in areas. It could also be based on separation of business entities with an organization.
Campus level occupancy data can be acquired using WiFi technology. Subsections under the Campus level in the Location Hierarchy will provide more granular occupancy outcomes.
Building Overview
Generally, buildings will be some individual structure that contains one or more floors in the hierarchy. This level of occupancy data is aggregated from all floors contained to a single building to illustrate the outcomes associated with it.
Building level occupancy data can be acquired using WiFi technology. Subsections under the Building level in the Location Hierarchy will provide more granular occupancy outcomes.
Floor Overview
Floor occupancy provides granular insights into how specific floors within a building are utilized, allowing for a more detailed level visibility than building occupancy. While building occupancy gives an overall view of how many people are present across the entire structure, floor occupancy focuses on individual floors, highlighting variations in usage between different areas. This enables more precise space optimization, resource allocation, and safety measures. It also allows businesses to understand patterns at a finer scale, such as which floors experience higher traffic, compared to the broader insights offered by building-wide data.
Zone Overview
Zone occupancy offers even more granular insights by focusing on specific areas or sections within a floor, providing a detailed understanding of how different zones are used. While floor occupancy looks at overall activity across an entire floor, zone occupancy pinpoints usage within designated areas like workspaces or corridors. This allows for targeted optimization of resources. Zone-level data helps identify high-traffic or underutilized spaces, enabling precise decisions on space planning and ensuring safety compliance in more confined areas compared to the broader analysis provided by floor or building occupancy.
Configuring Zones (Zone level occupancy only)
Please refer to our Configuration Guide for detailed steps for creating Zones.
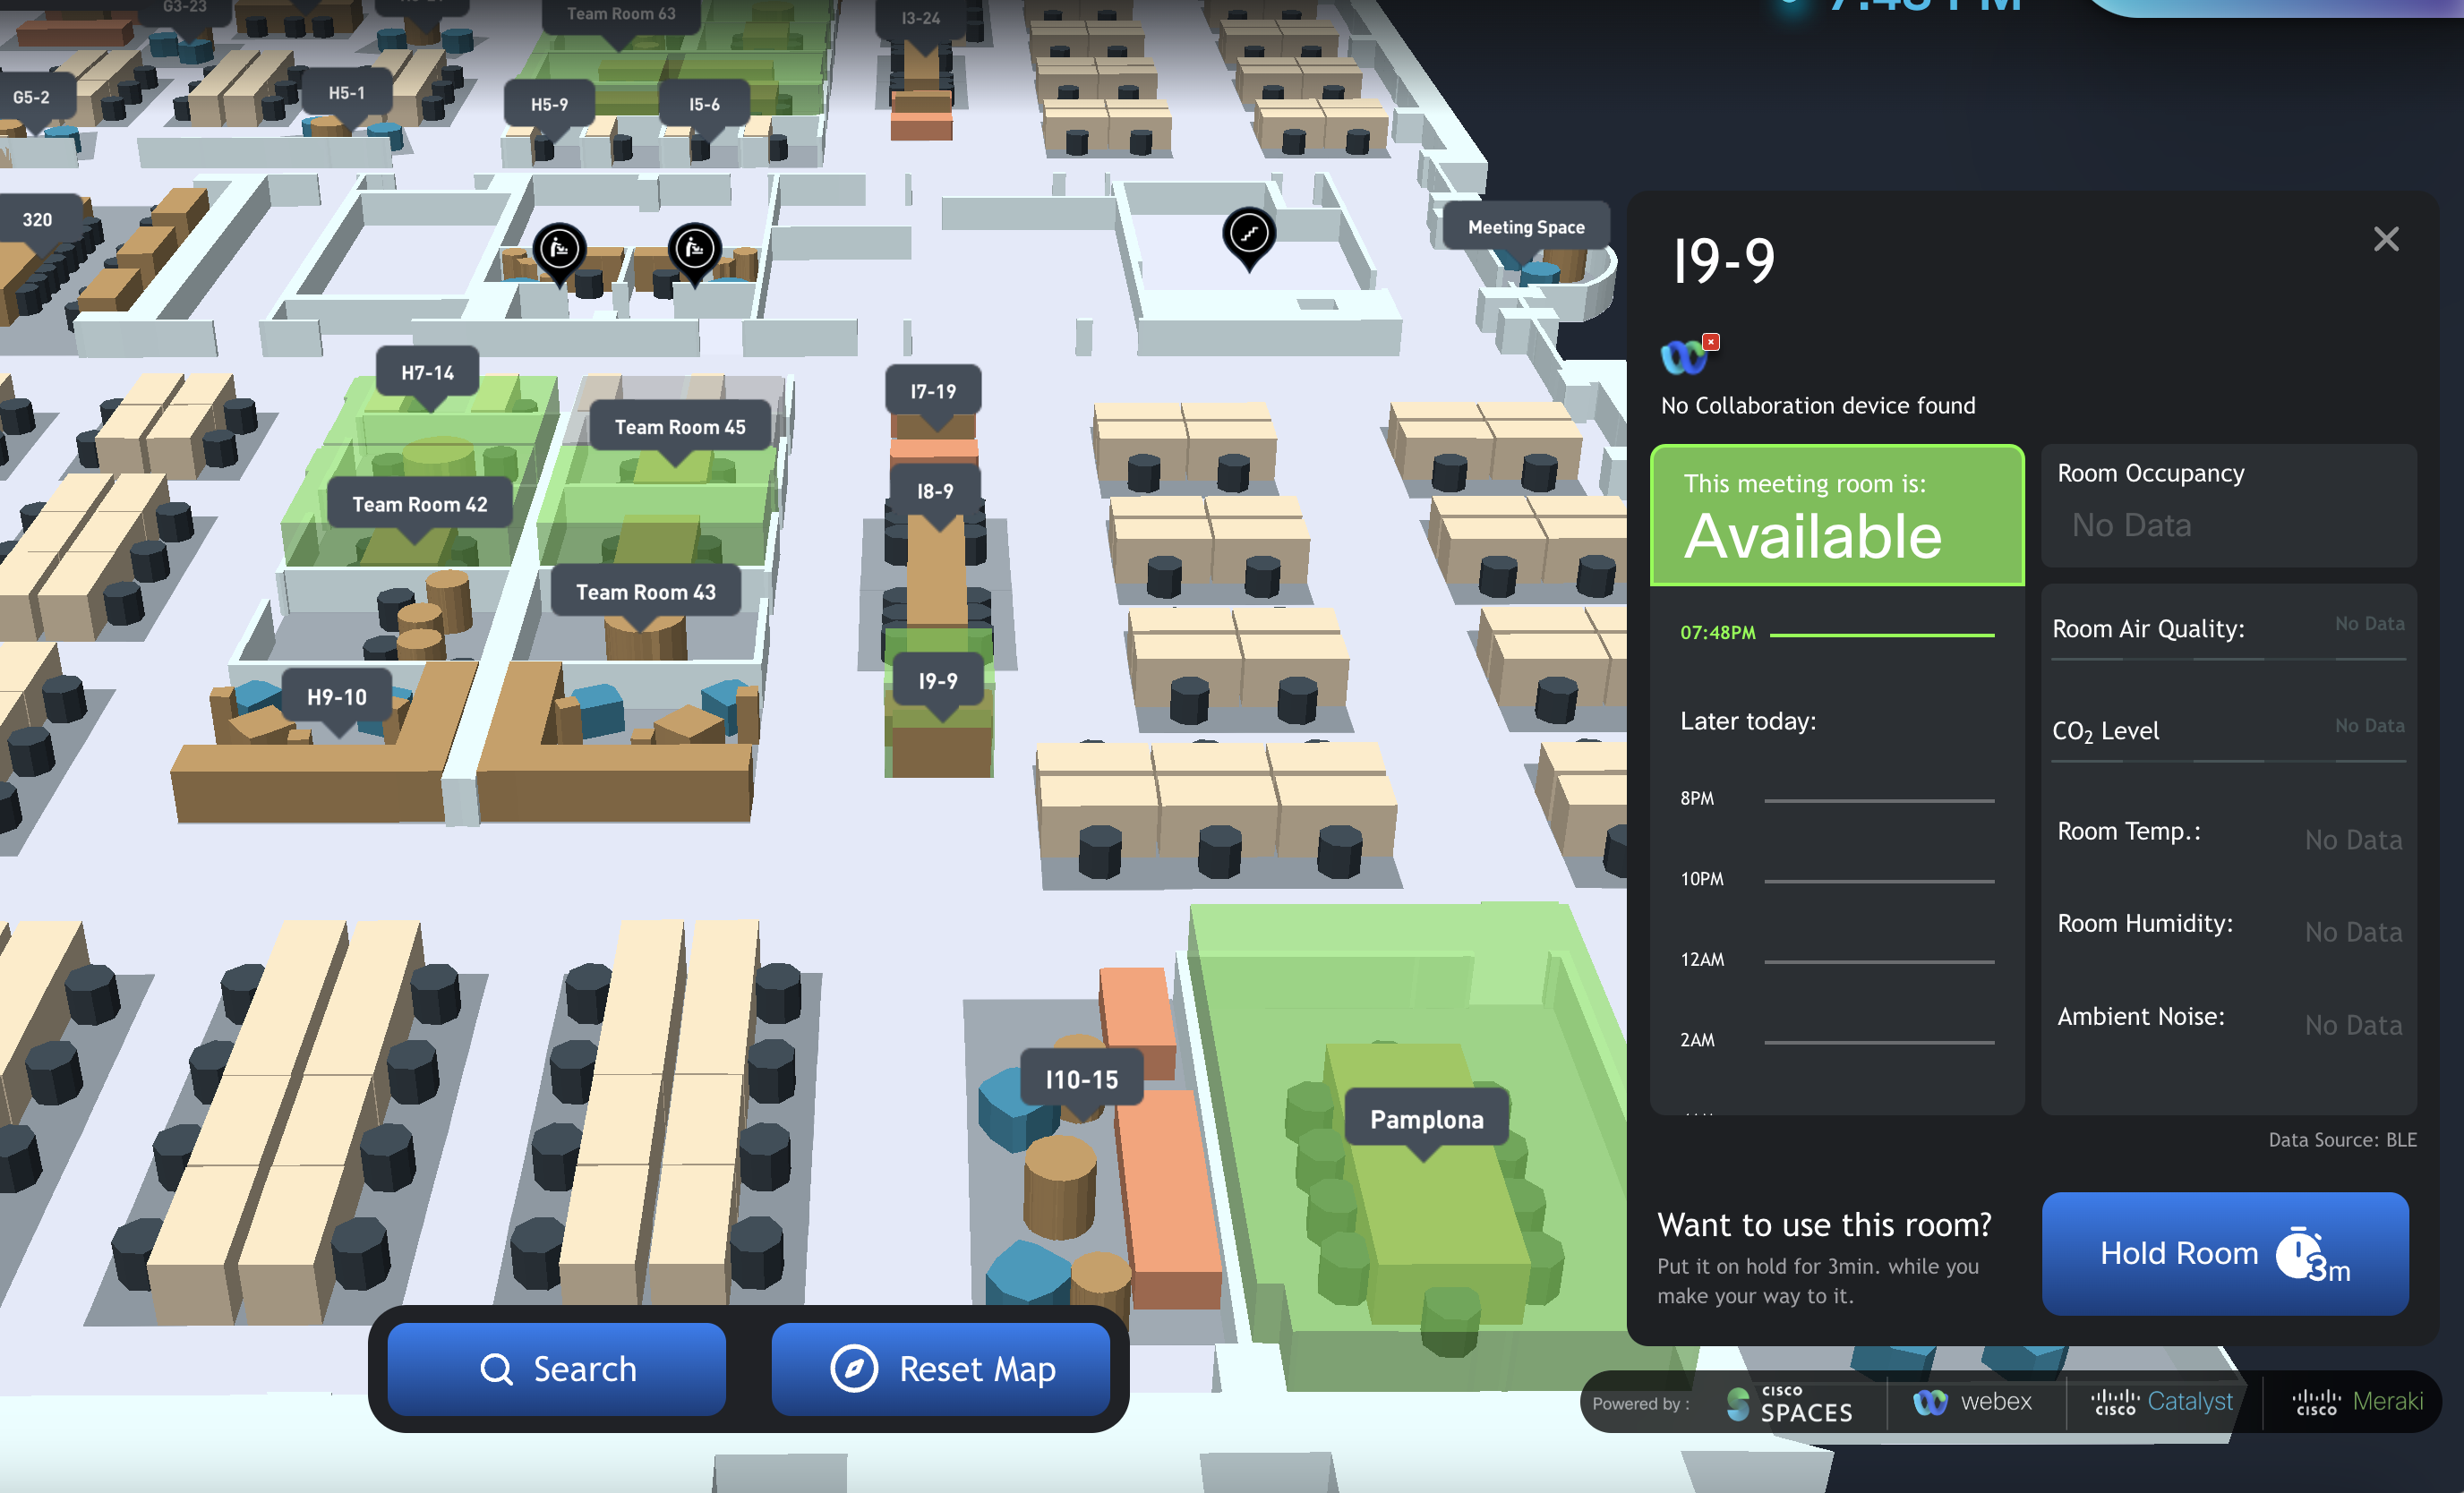
Room (Collaboration Occupancy)
Overview
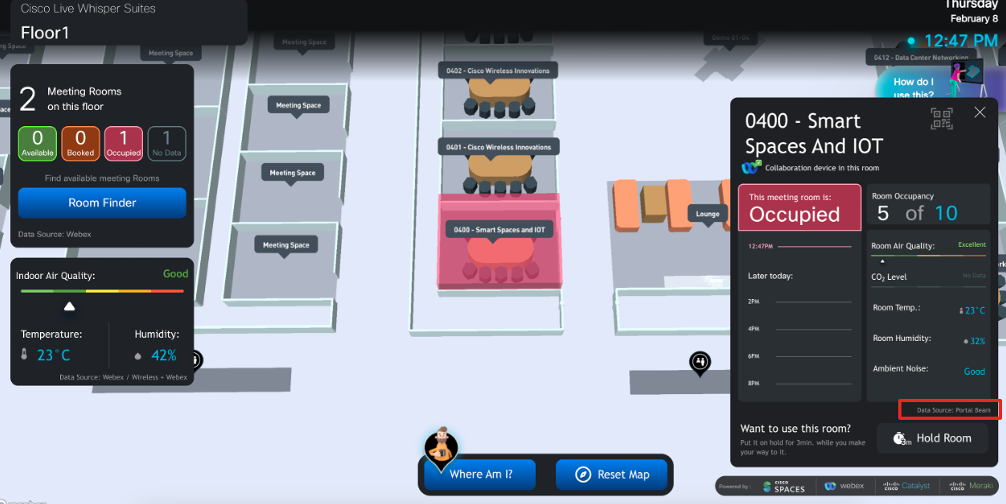
Room-level occupancy outcomes in Cisco Spaces involve using sensors and collaboration devices, such as Webex, to monitor and visualize live meeting room occupancy. This includes detecting room presence and people count. Additionally, other data types can be acquired, such as environmental conditions like air quality, temperature, and humidity. The data collected related to room occupancy helps optimize room usage and enhance employee productivity.
Prerequisites
Minimum Versions
If using Wireless IoT, 9100 APs, 9800 Controller, and Connector enabled.
Minimum version of 9800 controller – 17.3.1 for BLE, 17.7.1 for BLE+DNA Center Assurance at the same time, 17.9.1 for simultaneous BLE Tx and Rx
If using Wired IoT, Cat9300,9400 switches, Spaces connector enabled
Minimum version of Cat9300,9400 : 17.3.3 with DNA Advantage license
Minimum version of Connector 2.3.2 OVA. Recommend using the latest docker image.
See Connector section for version guidance
Verify hierarchy from Control Hub + Metadata
Webex Control Hub integration accurately organized into Locations > Floors > Workspaces > Devices (see section 2 on Location Hierarchy for more details)
Metadata
Platform level setting |
|
|
1: Pro Maps Upload | Mandatory for room metric and for heat map feature | Dashboard level setting: Setup > Locations & Maps > Digital Maps |
2: Associating occupancy sensors to rooms | Mandatory for room metrics | Space Manager > Space Management |
3: Defining default device for each room | Mandatory if rooms have >1 sensor | Space Manager > Space Management > click on an individual workplace |
Digital Maps: Room Naming + Collab Device Placement
As mentioned in Section 2 for creating Digital Maps verify that the follow steps have been completed:
When CAD files are finished processing (see section on Digital Map and CAD File Upload), edit room names/labels in the Digital Map Editor (under Setup > Locations & Maps > Digital Maps > Review)
In Space Manager > Space Management, assigning Webex devices to Rich Map workspaces
Using the Space Experience app to deploy digital kiosk app to a Webex Board or other kiosk display using a browser-based kiosk app
Optional onboarding task: Generate a kiosk app “Token URL” (not recommended, but sometimes necessary for digital kiosk displays that do not have the proper browser local storage)
Optimizing People Count in Meeting Rooms
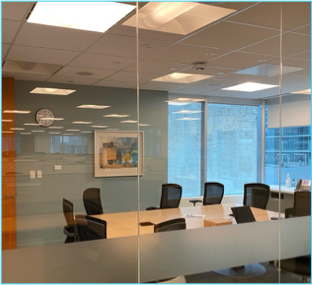
Since room-level occupancy relies on the camera sensors in the board, desk, and room devices, sometimes background people may be picked up within the camera frame even if they are not in the room. This may be due to glass walls and windows that may provide complete viewing of the spaces outside of the meeting room. To mitigate occupancy inaccuracies due to this, meeting zones may be configured to define the part of the room where people count will be applied to.
For detailed information about configuring meeting zones either on the devices or in Control Hub please review the meeting zone documentation.
Room (Portal Beam Occupancy)
Overview
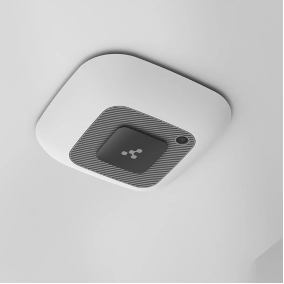
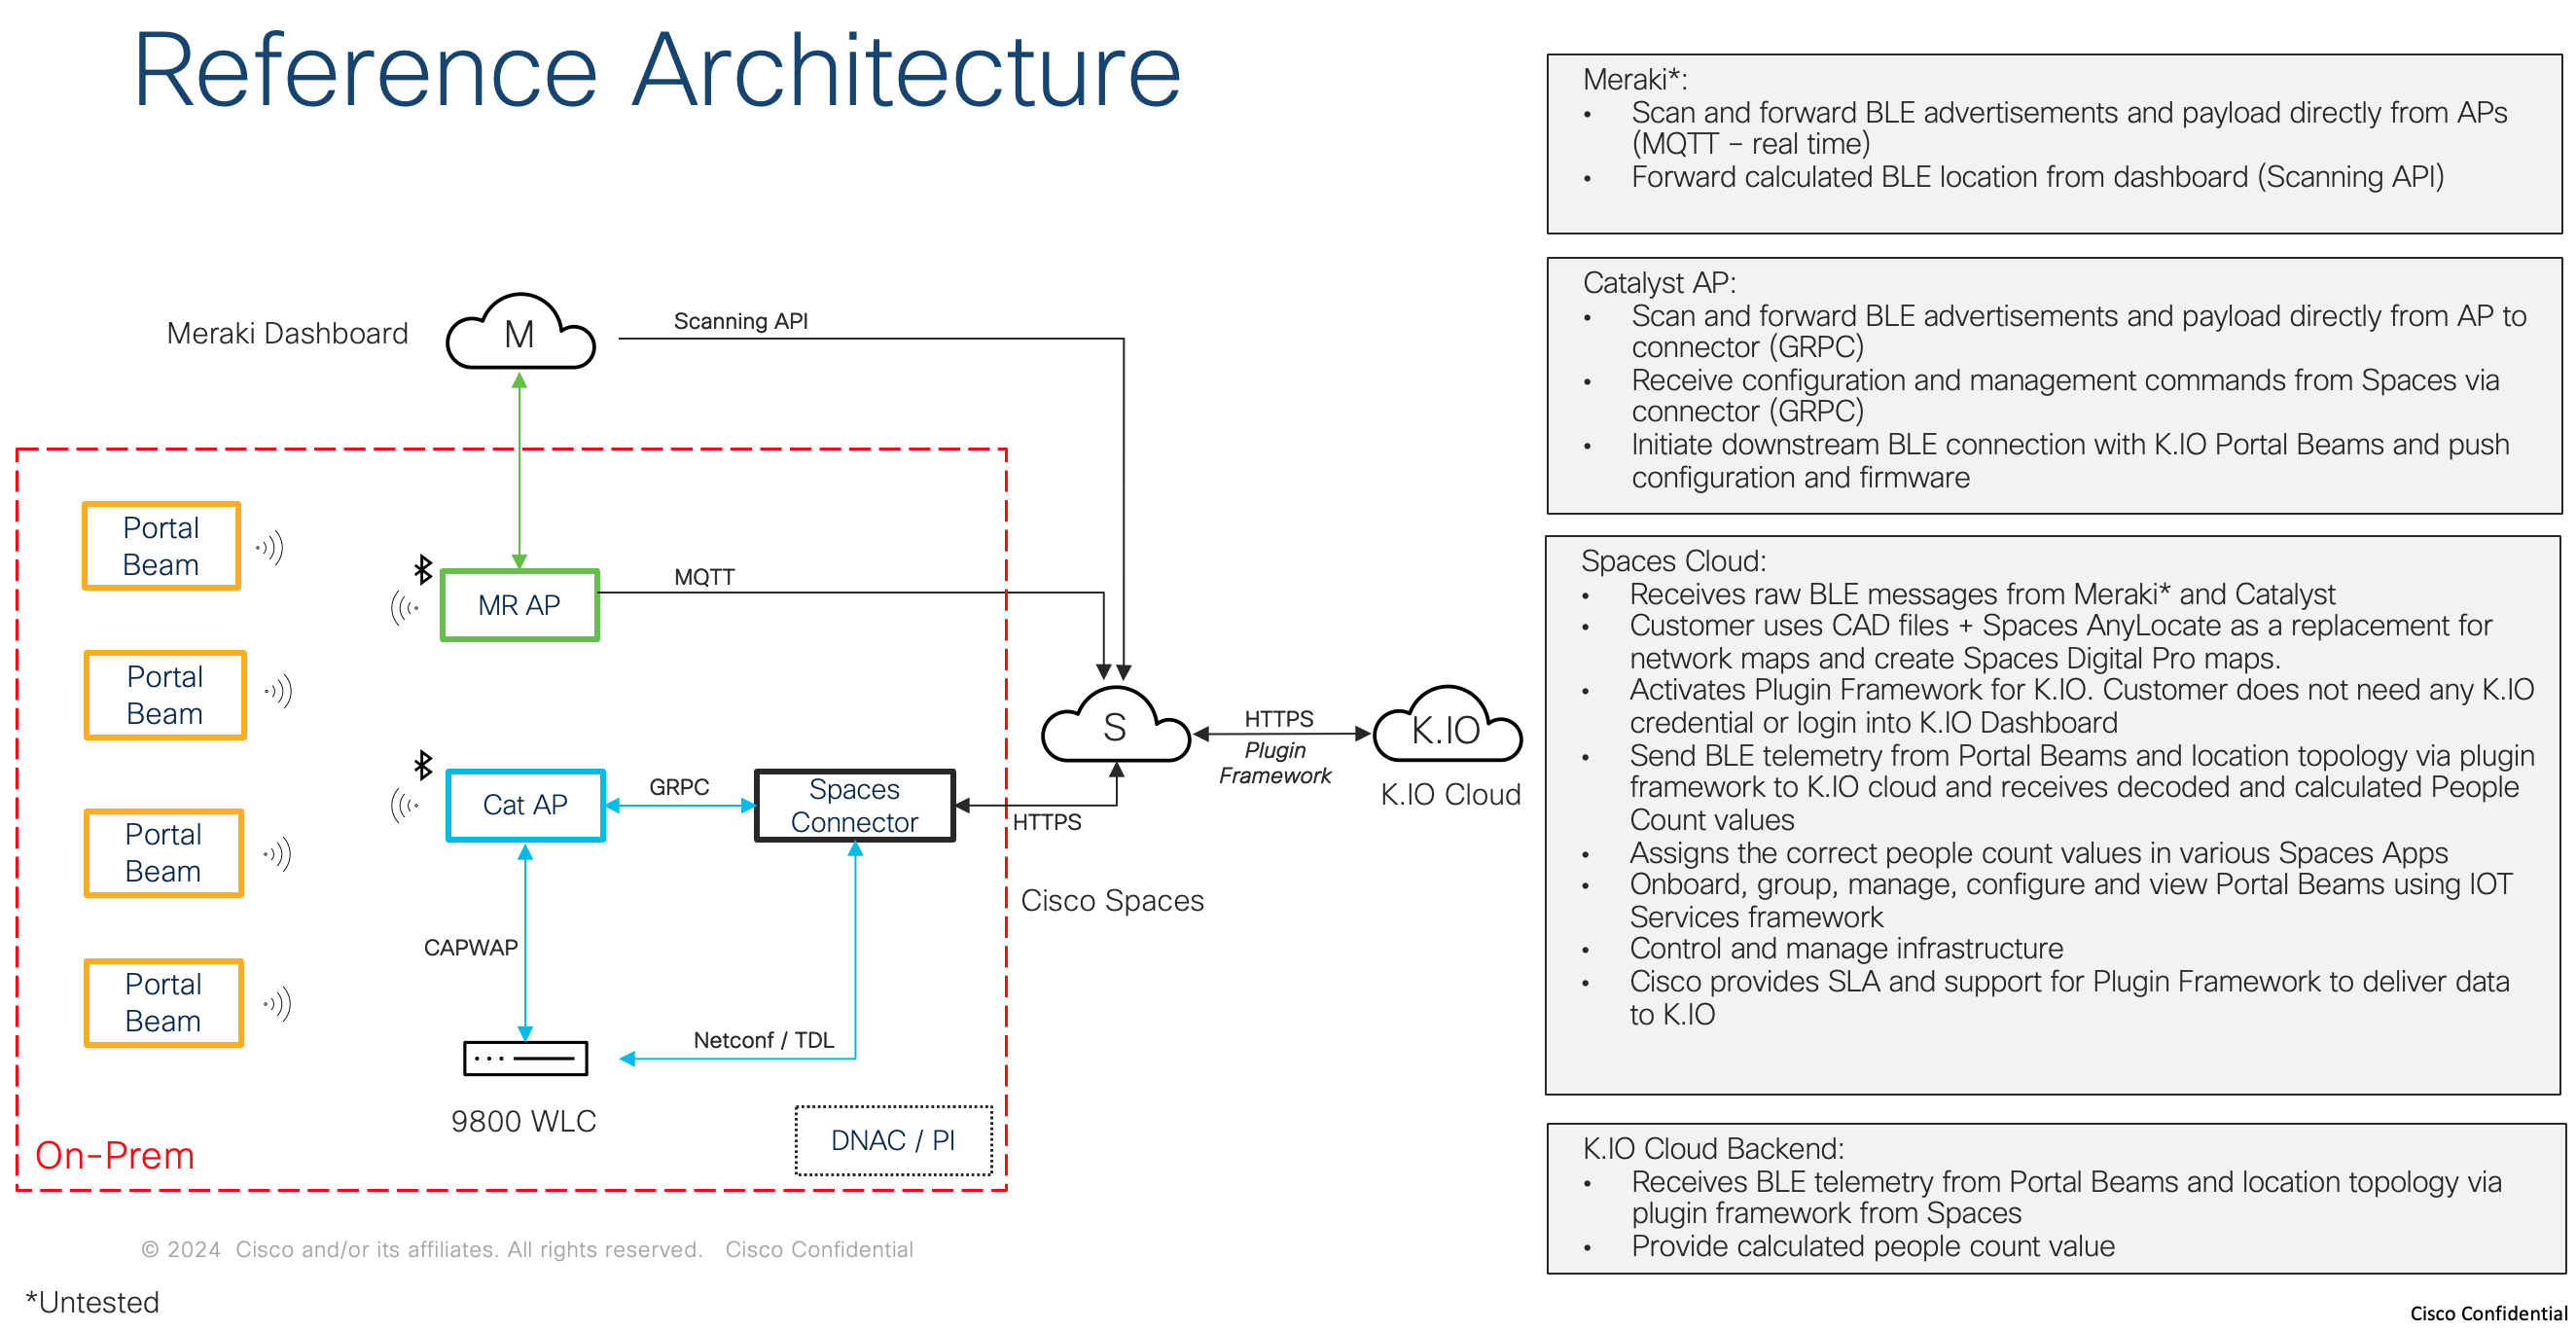
Cisco Spaces' solution partner, Kontakt.io’s device Portal Beam is a multi sensor BLE device that provides information about room occupancy (people count) and environmental data like temperature and humidity that is leveraged into Cisco Spaces outcome applications by leveraging the IOT Sensor Connect architecture (aka Indoor IOT Services). Portal Beams leverage the existing Cisco wireless access point infrastructure and Cisco Spaces plugin framework to provide additional visibility into occupancy within workspaces without needing any additional gateways or significant additional investments. With Cisco Spaces + Portal Beam joint solution, specific outcomes within Cisco Spaces can be met with a plug and play architecture that can be setup within minutes of physically installing the beam devices.
Prerequisites
Infrastructure Requirements:
For Catalyst based customers:
Cisco Catalyst 9800 WLC : with IOS-XE Versions of 17.9.6 or above (In 17.9 train) / 17.12.4 or above (In 17.12 train) / 17.15.1 or above (in 17.15 train). While BLE is technically supported in older and other releases, due to key BLE related bug fixes that are present in the above specific version, only these specific versions are going to be supported.
AP Models : C9120 or above, with the latest Spaces BLE Gateway installed (aka BLE IOX App) While BLE is technically supported in some other AP models and may work without the IOX App installed, due to performance requirements, the mentioned combination is going to be supported.
Spaces Connector : Spaces Connector version 3.1 or above, with the latest released docker versions. Spaces Connector version 2.3 is no longer supported. Refer to the Spaces OS runbook for the correct guidance for the sizing of the connector.
For Meraki based customers:
This combination has not undergone validation. We recommend engaging with the Spaces product management teams to explore this use case further.
Cisco Application Requirements:
Maps : Cisco Spaces Digital Map (aka CAD based Rich Map) is required. Refer to the best practices for the Rich Map for making sure the map is meeting basic requirements such as names, layers, etc.
Maps : Right Access Points need to be placed on the network map either using Catalyst Center, Prime Infrastructure or using Cisco Spaces Any Locate feature. Either way, the APs need to be correctly positioned on the floor plan.
Licensing : Cisco Spaces Act or Unlimited License is required.
(Optional) Cisco Webex Pro Boards : One of the outcome applications consuming the room telemetry data will be the Kiosk experience. If needing to deploy the kiosk using Portal Beam data, Cisco Webex Pro boards will also be needed. Refer to the right runbook for those details.
Kontakt Requirements:
Access to physical Portal Beam devices
Depending on how the devices were purchased, correct Kontakt licensing or support SKUs. If purchased with Cisco Solutions Plus, then appropriate SKUs should be added already. Please work with the sales teams to make sure correct licensing is in place.
Supported and Unsupported Functionality
Supported Functionality:
In the currently available Cisco Spaces + Portal Beam architecture, the following functionality and outcomes are supported:
For Environmental Sensor Data (Temperature and Relative Humidity):
App or Feature | Frequency of Data | Data |
|---|---|---|
Space Manager App Room occupancy view | Real time | Temperature and Relative Humidity |
IOT Services | Real time | Temperature and Relative Humidity |
Environmental Analytics | Real time & historical | Temperature and Relative Humidity |
Meta API (Firehose API) | Real time | Temperature and Relative Humidity |
For People Count (Room Occupancy) Data:
App or Feature | Frequency of Data | Outcome |
|---|---|---|
Kiosk | Real time | People count on rich map |
Space Manager App Room occupancy view | Real time | Binary room occupancy (i.e., occupied or unoccupied) |
Space Manager App Room occupancy report | Historical | (IN BETA) People count and binary room occupancy as an exportable report |
Supported Verticals: Workspaces.
While other verticals may have similar use case and room types etc. where the solution may work just as well, Cisco has validated this solution only in workspaces verticals and is the only vertical type supported for now.
Supported Space Types: Meeting Rooms, Conference Rooms, Small Audio Privacy Rooms.
Room occupancy:
Single Beam in a room → 10 people per Beam for rooms <= 10 people
Multiple Beams in a room → 8 people per Beam for rooms > 10 people (*not available today, roadmap feature)
While other room types may have similar use case where the solution may work just as well, Cisco has validated this solution only with meeting room or small closed rooms and are the only room types where this solution is supported. Large conference rooms or rooms requiring multiple portal beams in a single room are currently not supported.
Room occupancy in kiosk
Room occupancy in Space Manager
Unsupported Functionality:
The following functionalities and outcomes are currently not supported by the Cisco Spaces + Portal Beam solution. While there is potential for these features to be introduced in the future, there is no official confirmation or guarantee at this time, and they are currently unavailable to customers.
If needed, please work directly with Cisco Spaces product team to discuss further.
For People Count (Room Occupancy) Data:
App or Feature | Frequency of Data | Outcome |
Space Utilization App | Historical | Room People Count in the dashboard |
Meta API (Firehose API) | Real time | People Count and Room occupancy |
Smart Rooms | Real time | HVAC control based on occupancy |
Smart Desks | Real time | Desk Occupancy and monitoring |
In addition, while the Portal Beam device may support other functionality, the current joint solution is limited and does not support:
Desk Occupancy from Portal Beam in Spaces
IR based location in Spaces
Room Occupancy with multiple Portal Beams in a single room in Spaces
Integration with Portal Lights as a 3rd party gateway (Not a supported architecture)
Reference Architecture
Deployment Workflow
This is the workflow for deploying Cisco Spaces + Portal Beam joint solution.
In Cisco Spaces:
Step 1 - Claim Kontakt Order ID in Spaces IOT Services
This can be done before or after the devices have been delivered. Generally, the order ID comes with the devices and the devices can be claimed even before they are powered on.
Log into the Spaces account
From the left-menu, go to IoT Services > Device Management.
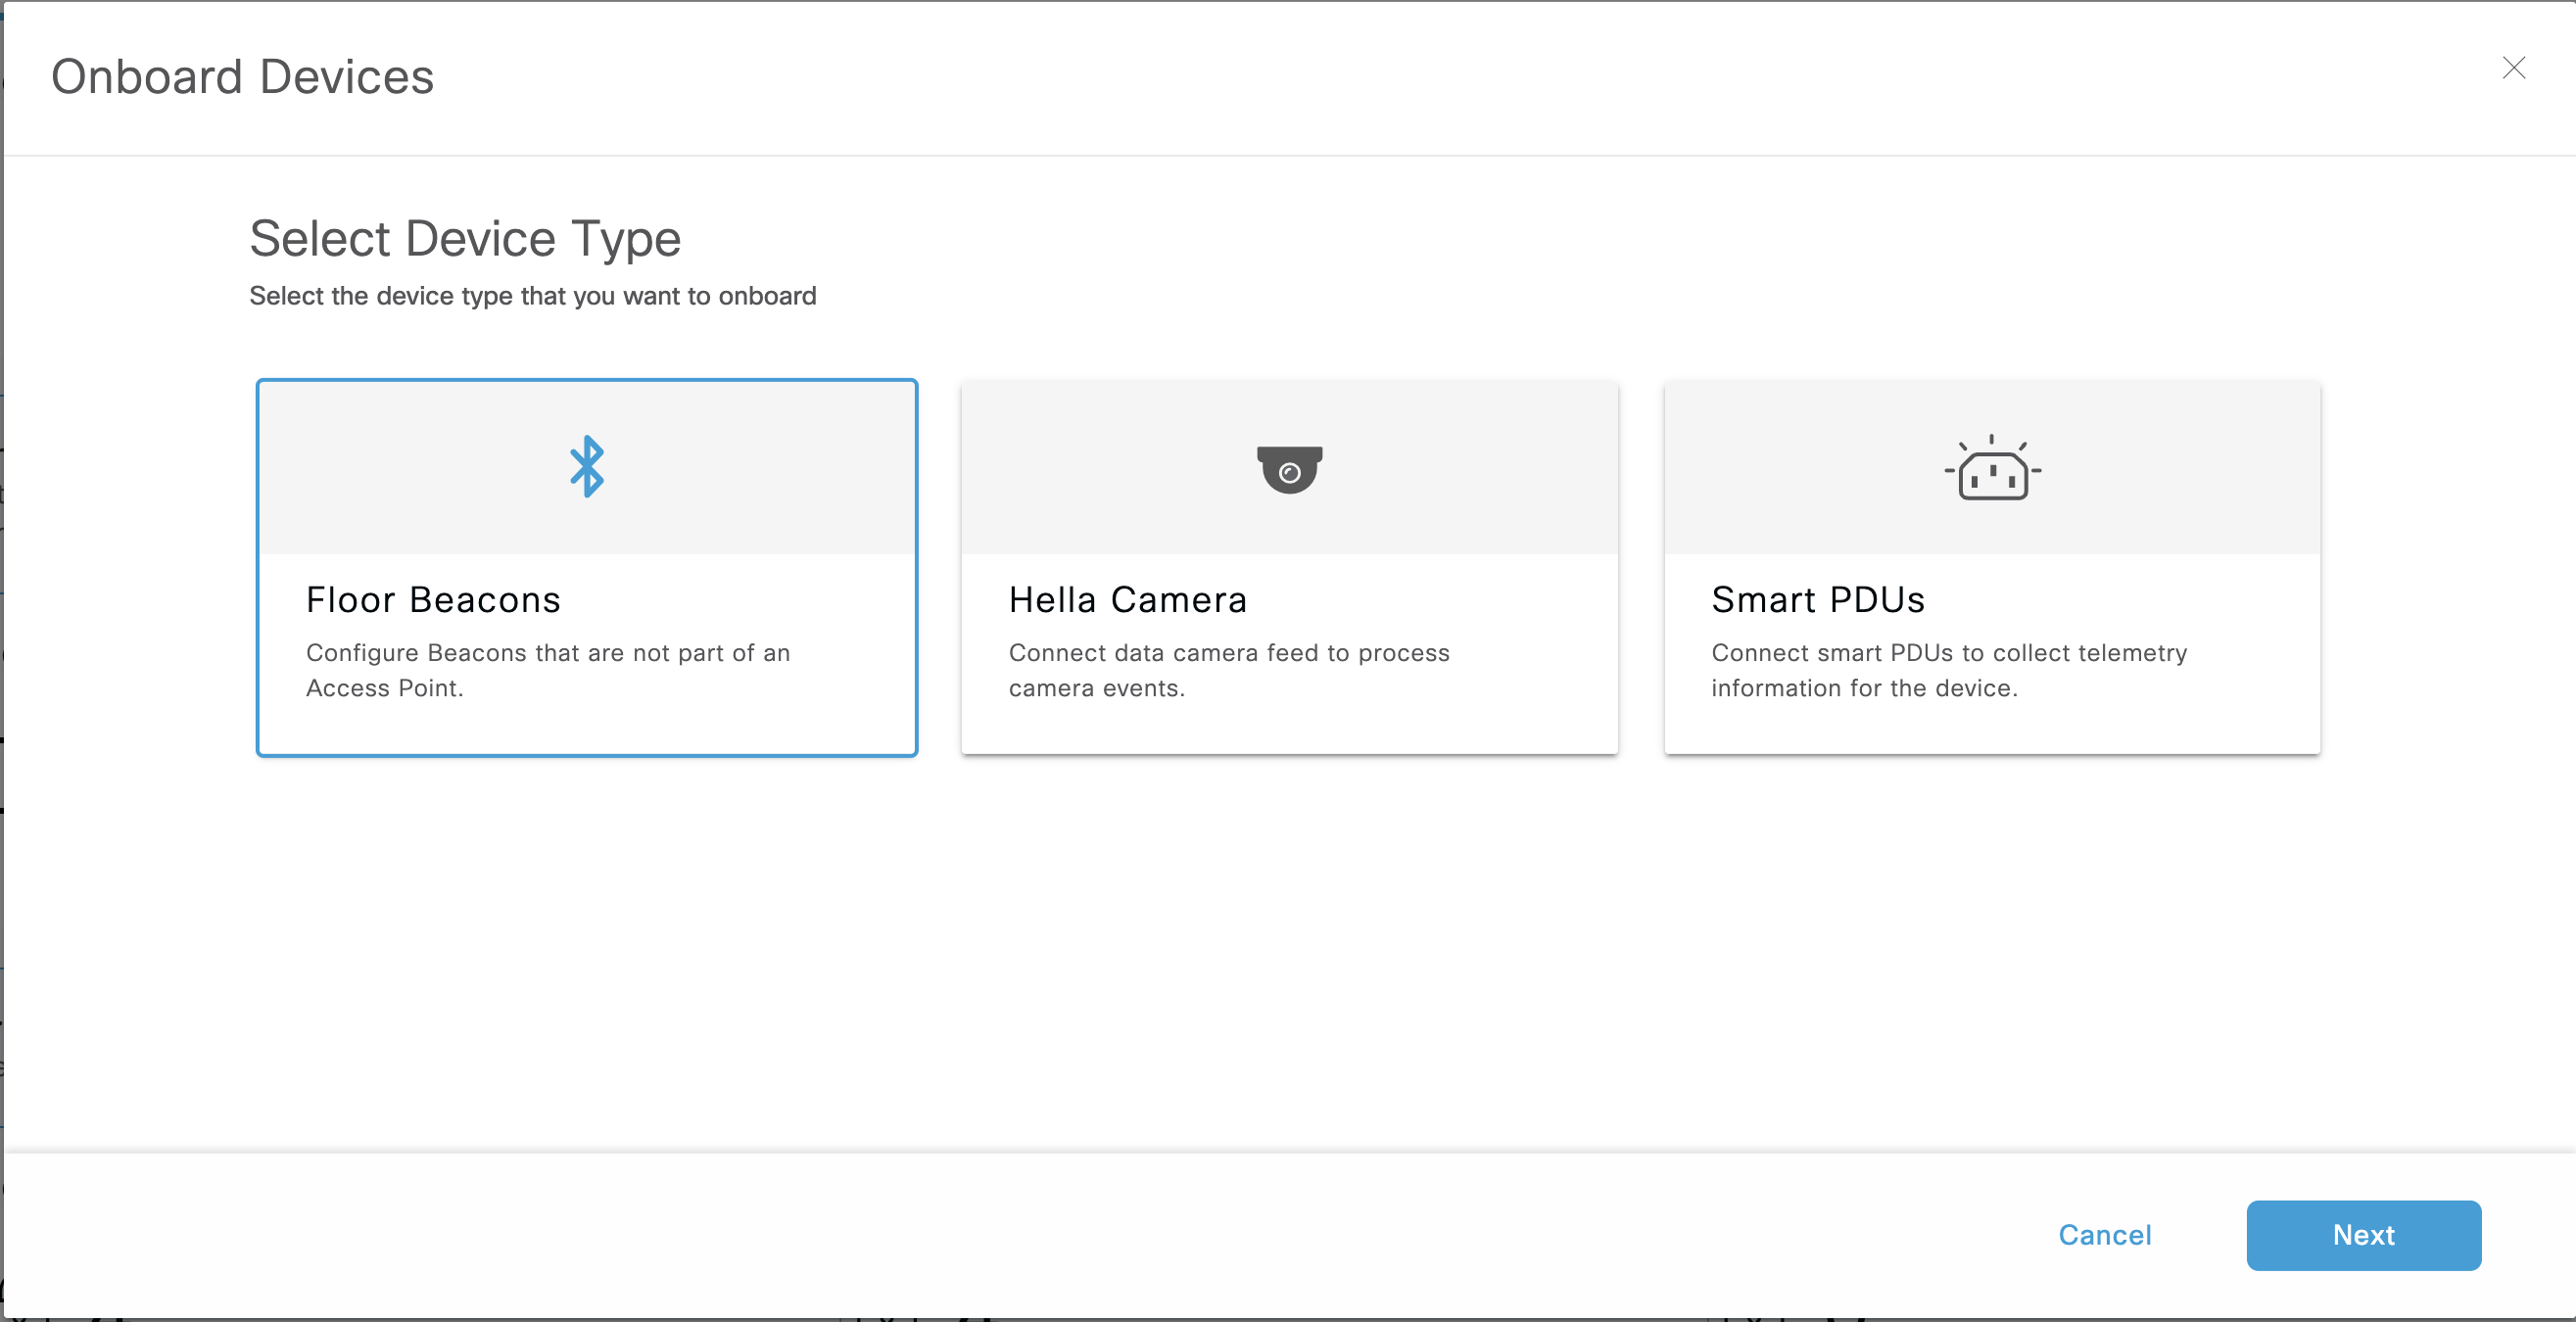
Select Onboard Devices > Floor Beacons > Next.
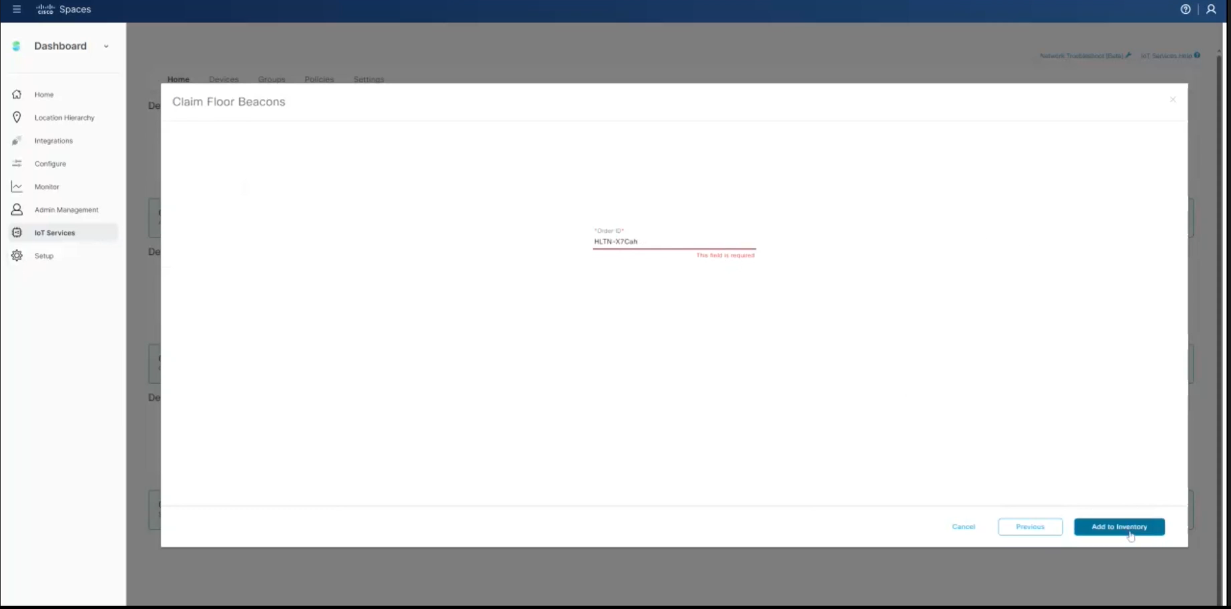
Enter the http://Kontakt.io Order ID (it's case sensitive) > and select Add to Inventory.
To verify the devices were successfully claimed, from Device Management, go the Devices tab, Floor Beacons > Claimed Devices > verify the claimed devices are listed.
Portal Beam devices are identified as Floor Beacons.
Step 2 - Activate Kontakt Portal Beam Plugin
This functionality is currently not exposed to all customers in the Spaces dashboard. Please work with Cisco Spaces product team to get this activated for the tenant and we can enable this from the backend.
Step 3 - Activate Kontakt Device Management Plugin
This step allows the use Kontkat's Kio Setup Manager mobile app to complete the setup of the Portal Beams. The plugin only applies to Portal Beams claimed within Cisco Spaces.
Get Cisco Spaces Device Management Server API Key
Log in to the Spaces account where the Portal Beams have been claimed.
Go to IoT Services > Device Management.
From the top menu, select Devices > select the Mac Address of a device > from the Beacon Configuration section, select Advance Configuration > select Confirm.
From the Server API Key section, select Copy to clipboard. This API Key is required in the next step.
Activate Kontakt Device Management plugin
From a web browser, go to the below URL specific to the Cisco Spaces account region. If not already signed in to Cisco Spaces, there will be a prompt to sign in.
United States region: https://plugin-app.cloud.us.kontakt.io/device-management/
Europe region: https://plugin-app.cloud.uk.kontakt.io/device-management/
From the Add Devices menu, select Device Federation.
Paste the Cisco Spaces Device Manager Server Key into the below field.
To confirm the plugin activation, from the Inventory menu, select Infrastructure > verify the Portal Beams are listed.
Be sure to bookmark the region's Device Management Plugin URL.
Once the Portal Beams are mounted and setup, they can be viewed and managed in the settings from this plugin and can view the last thermal image captured and shared from the Kio Setup Manager mobile app.
For Steps 4 and 5 - Cisco highly recommends using Kontakt’s official installer service to make sure devices are correctly installed and configured. Cisco will not be responsible for any incorrect data that may be generated due to that. Please work with a Kontakt representative to get additional details. Nonetheless, if customers still want to move forward on their own, these are the steps.
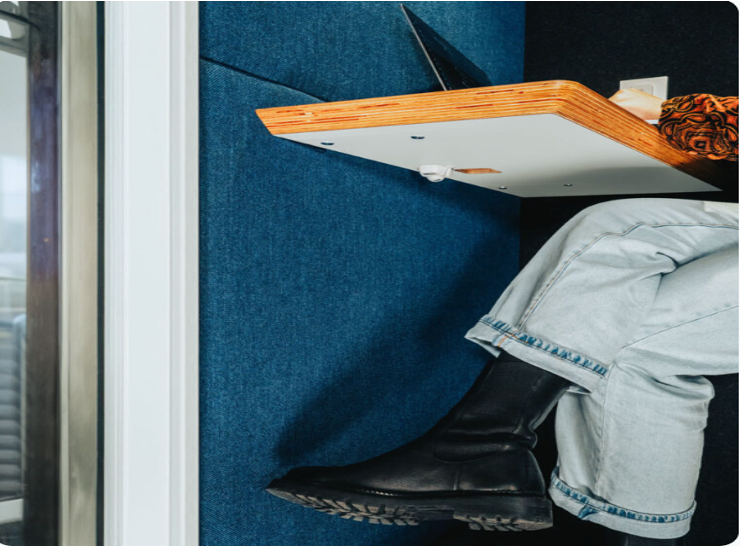
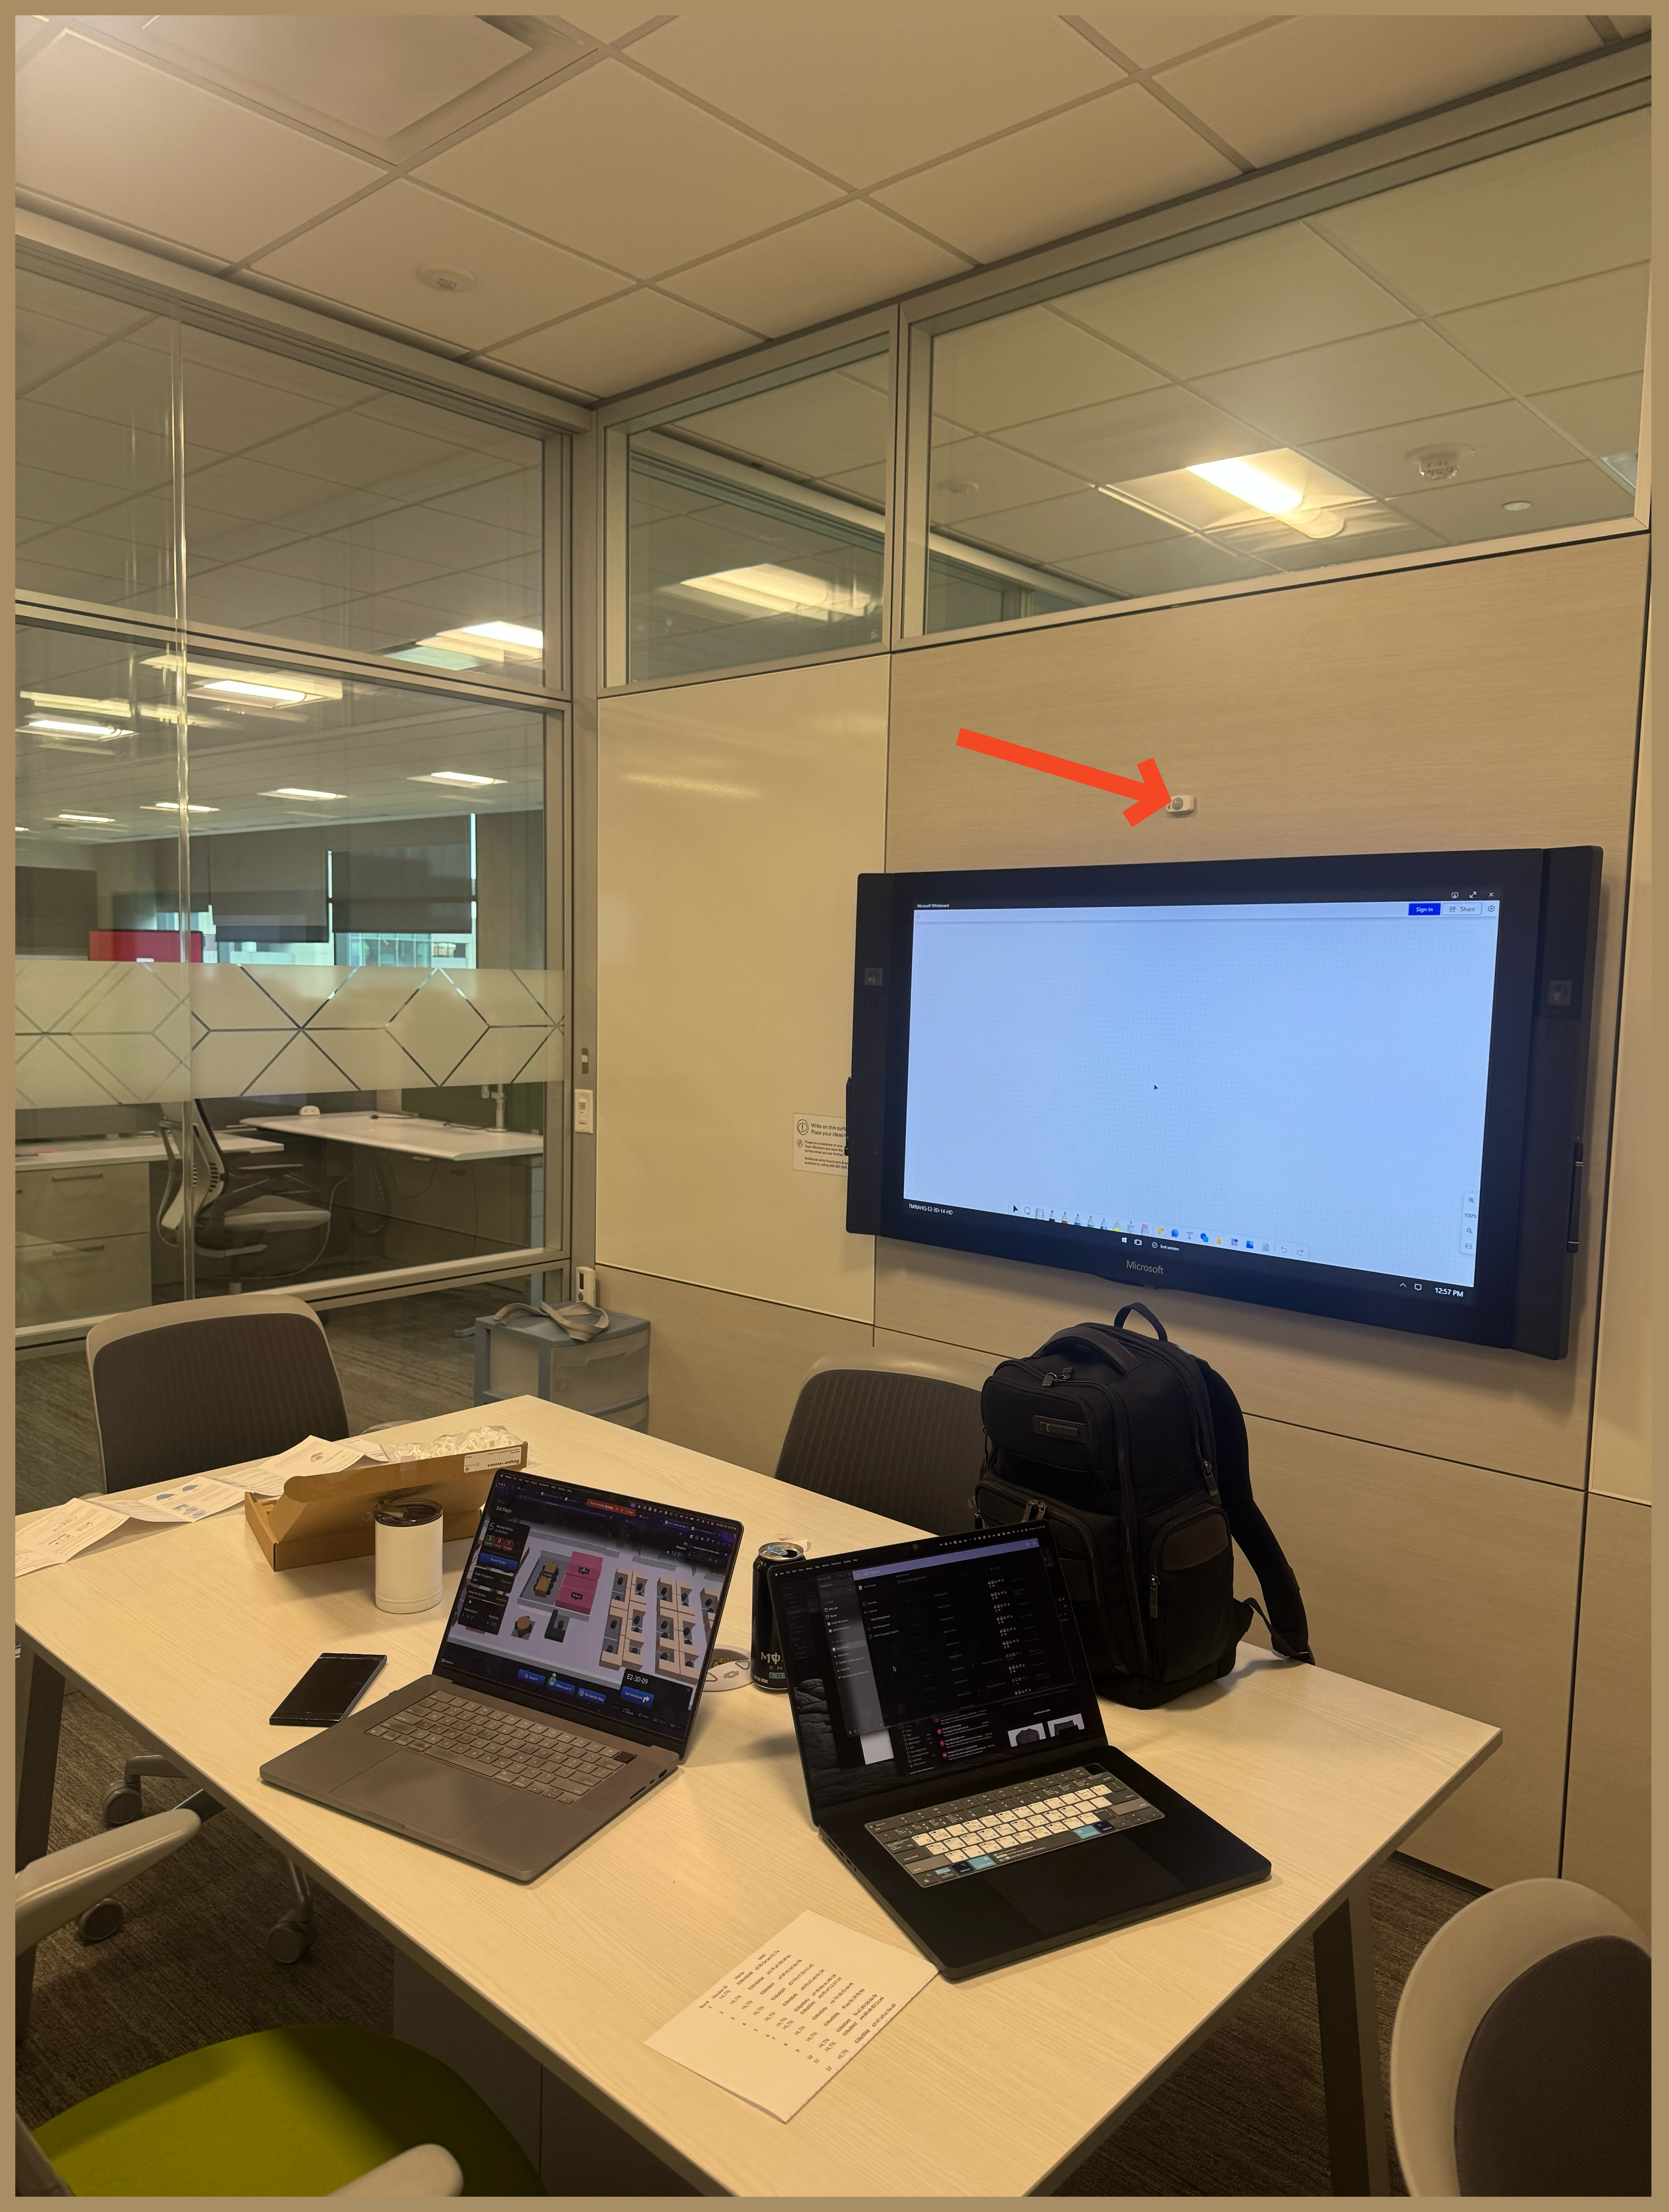
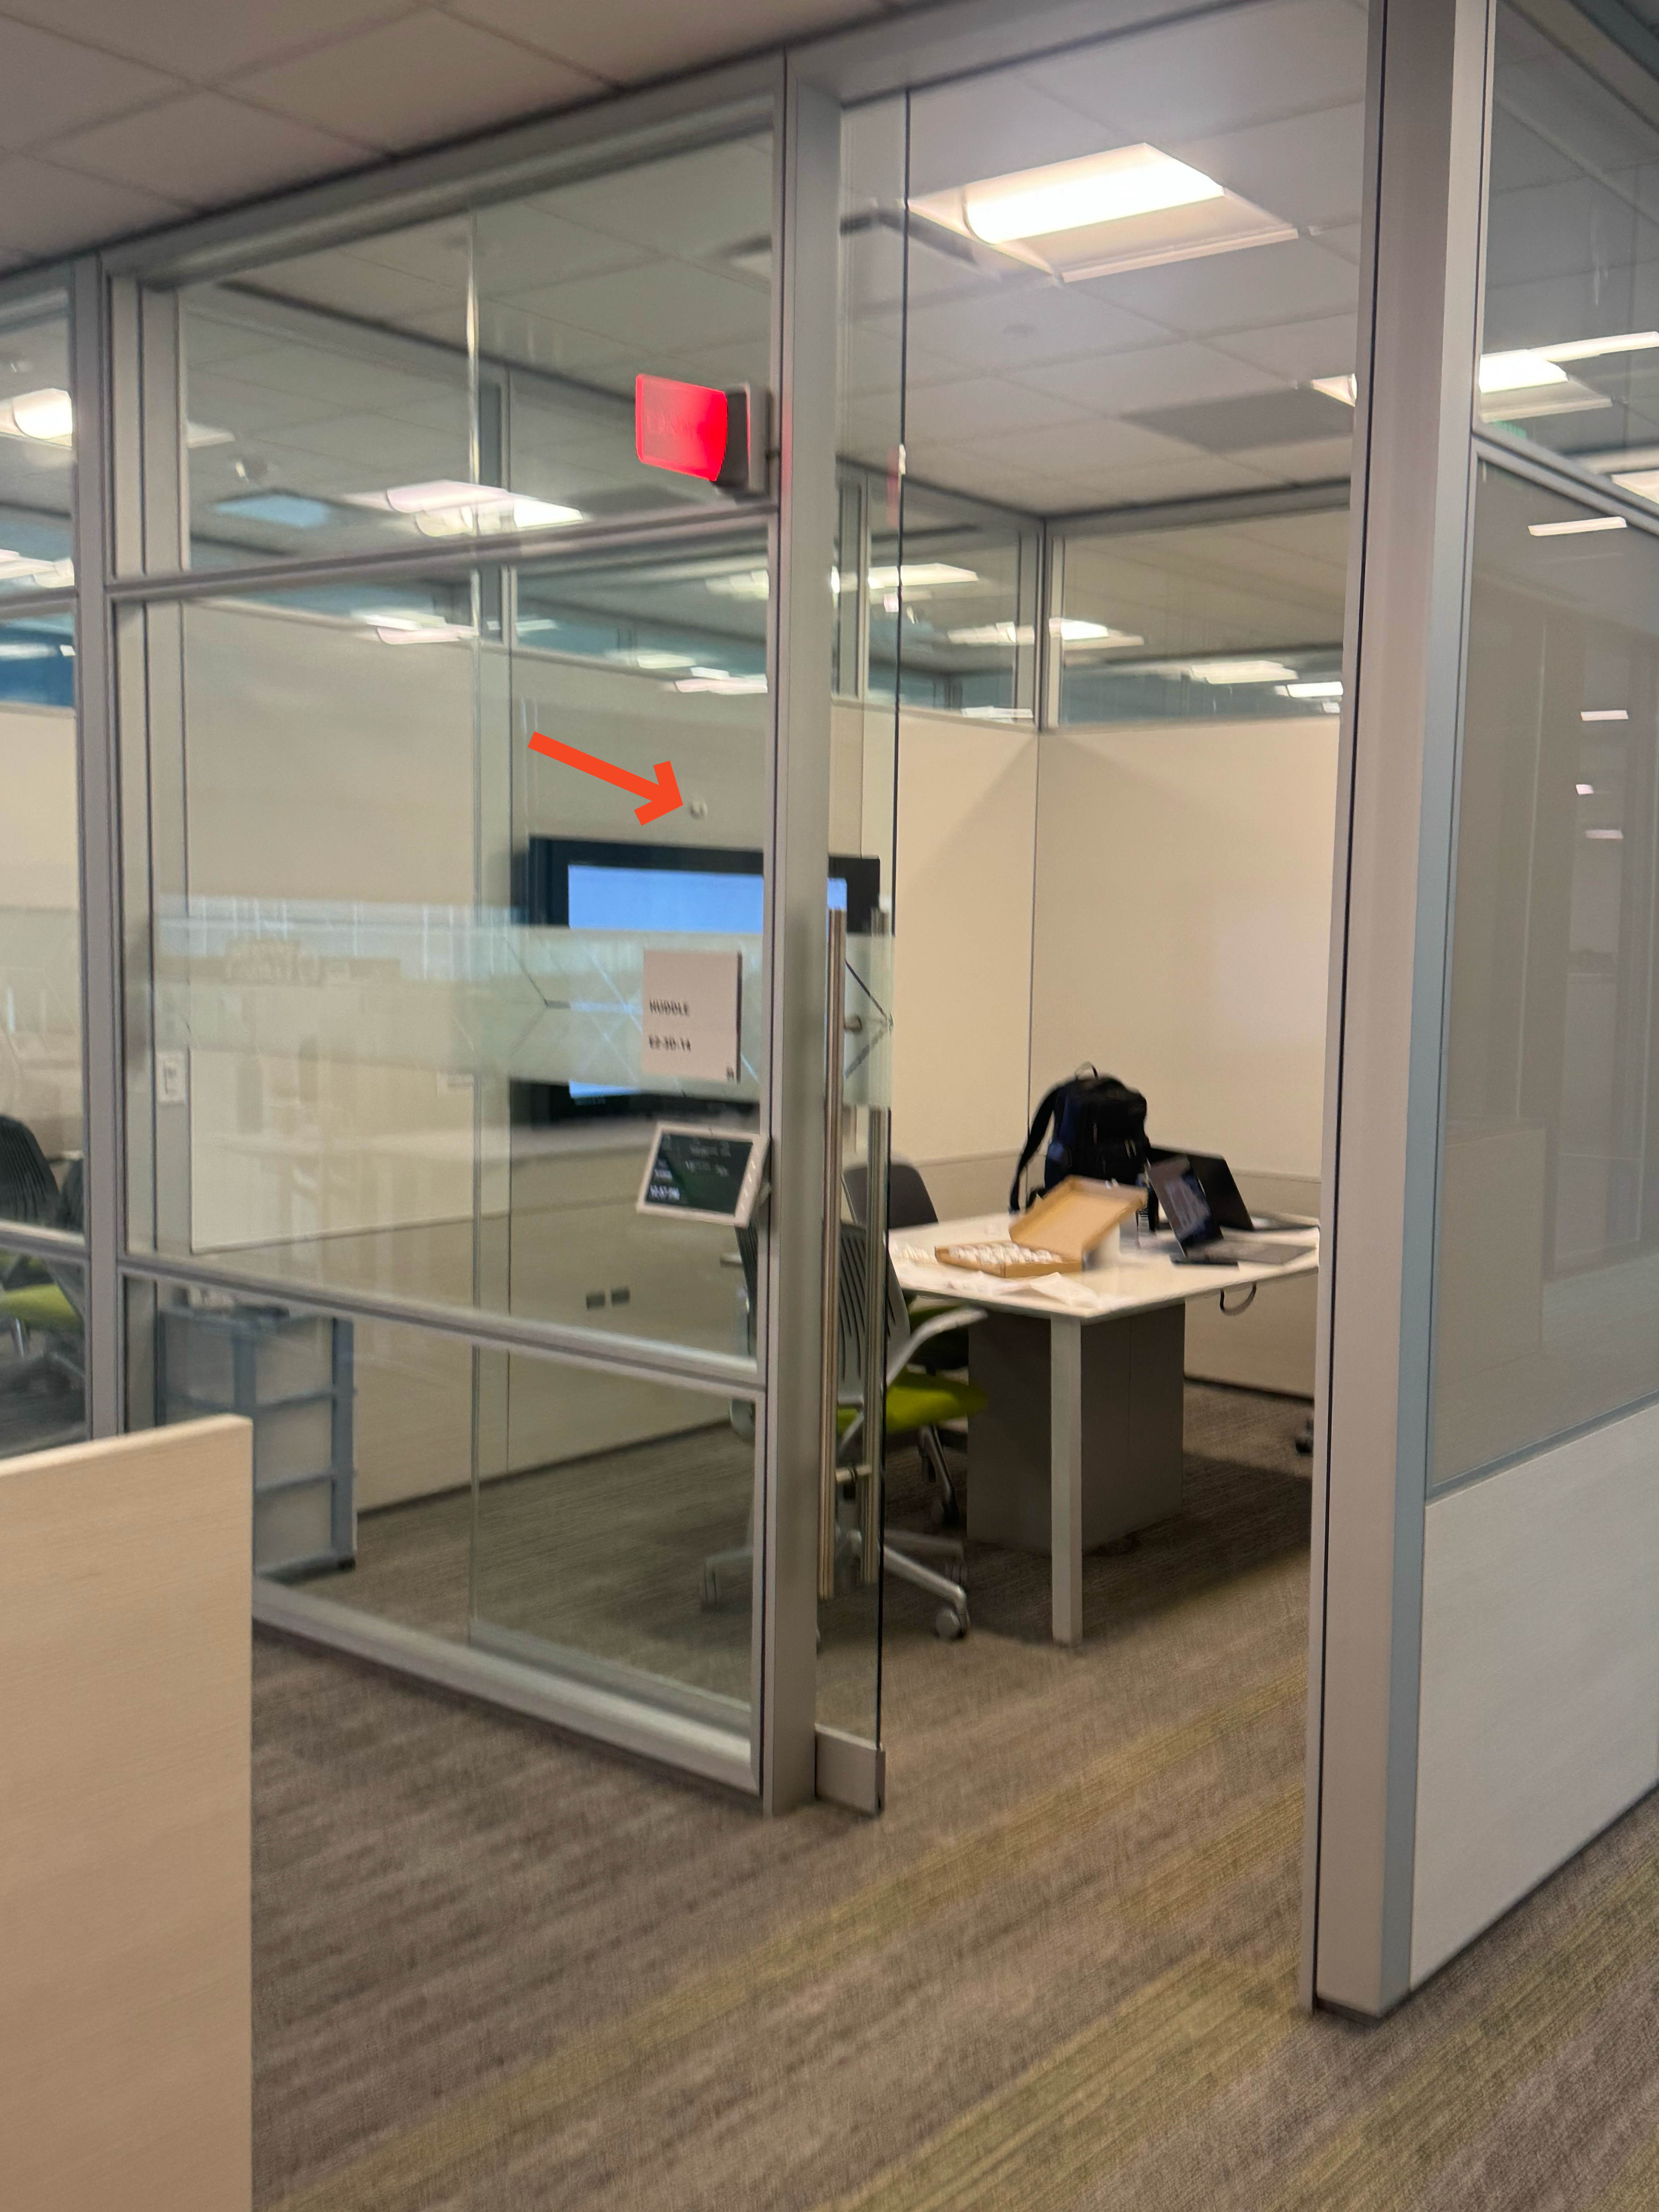
Step 4 - Mount Portal Beam
Before beginning, review the Portal Beam placement and coverage area guidelines and ceiling mount instructions.
Write down the Portal Beam's Unique ID and MAC address printed on its underside. This is needed during the next step.
Turn on the Portal Beam > from its underside, move its battery switch to the ON position.
Mount the Portal Beam to the ceiling.
Step 5 - Setup and Verify Portal Beam Settings and Coverage
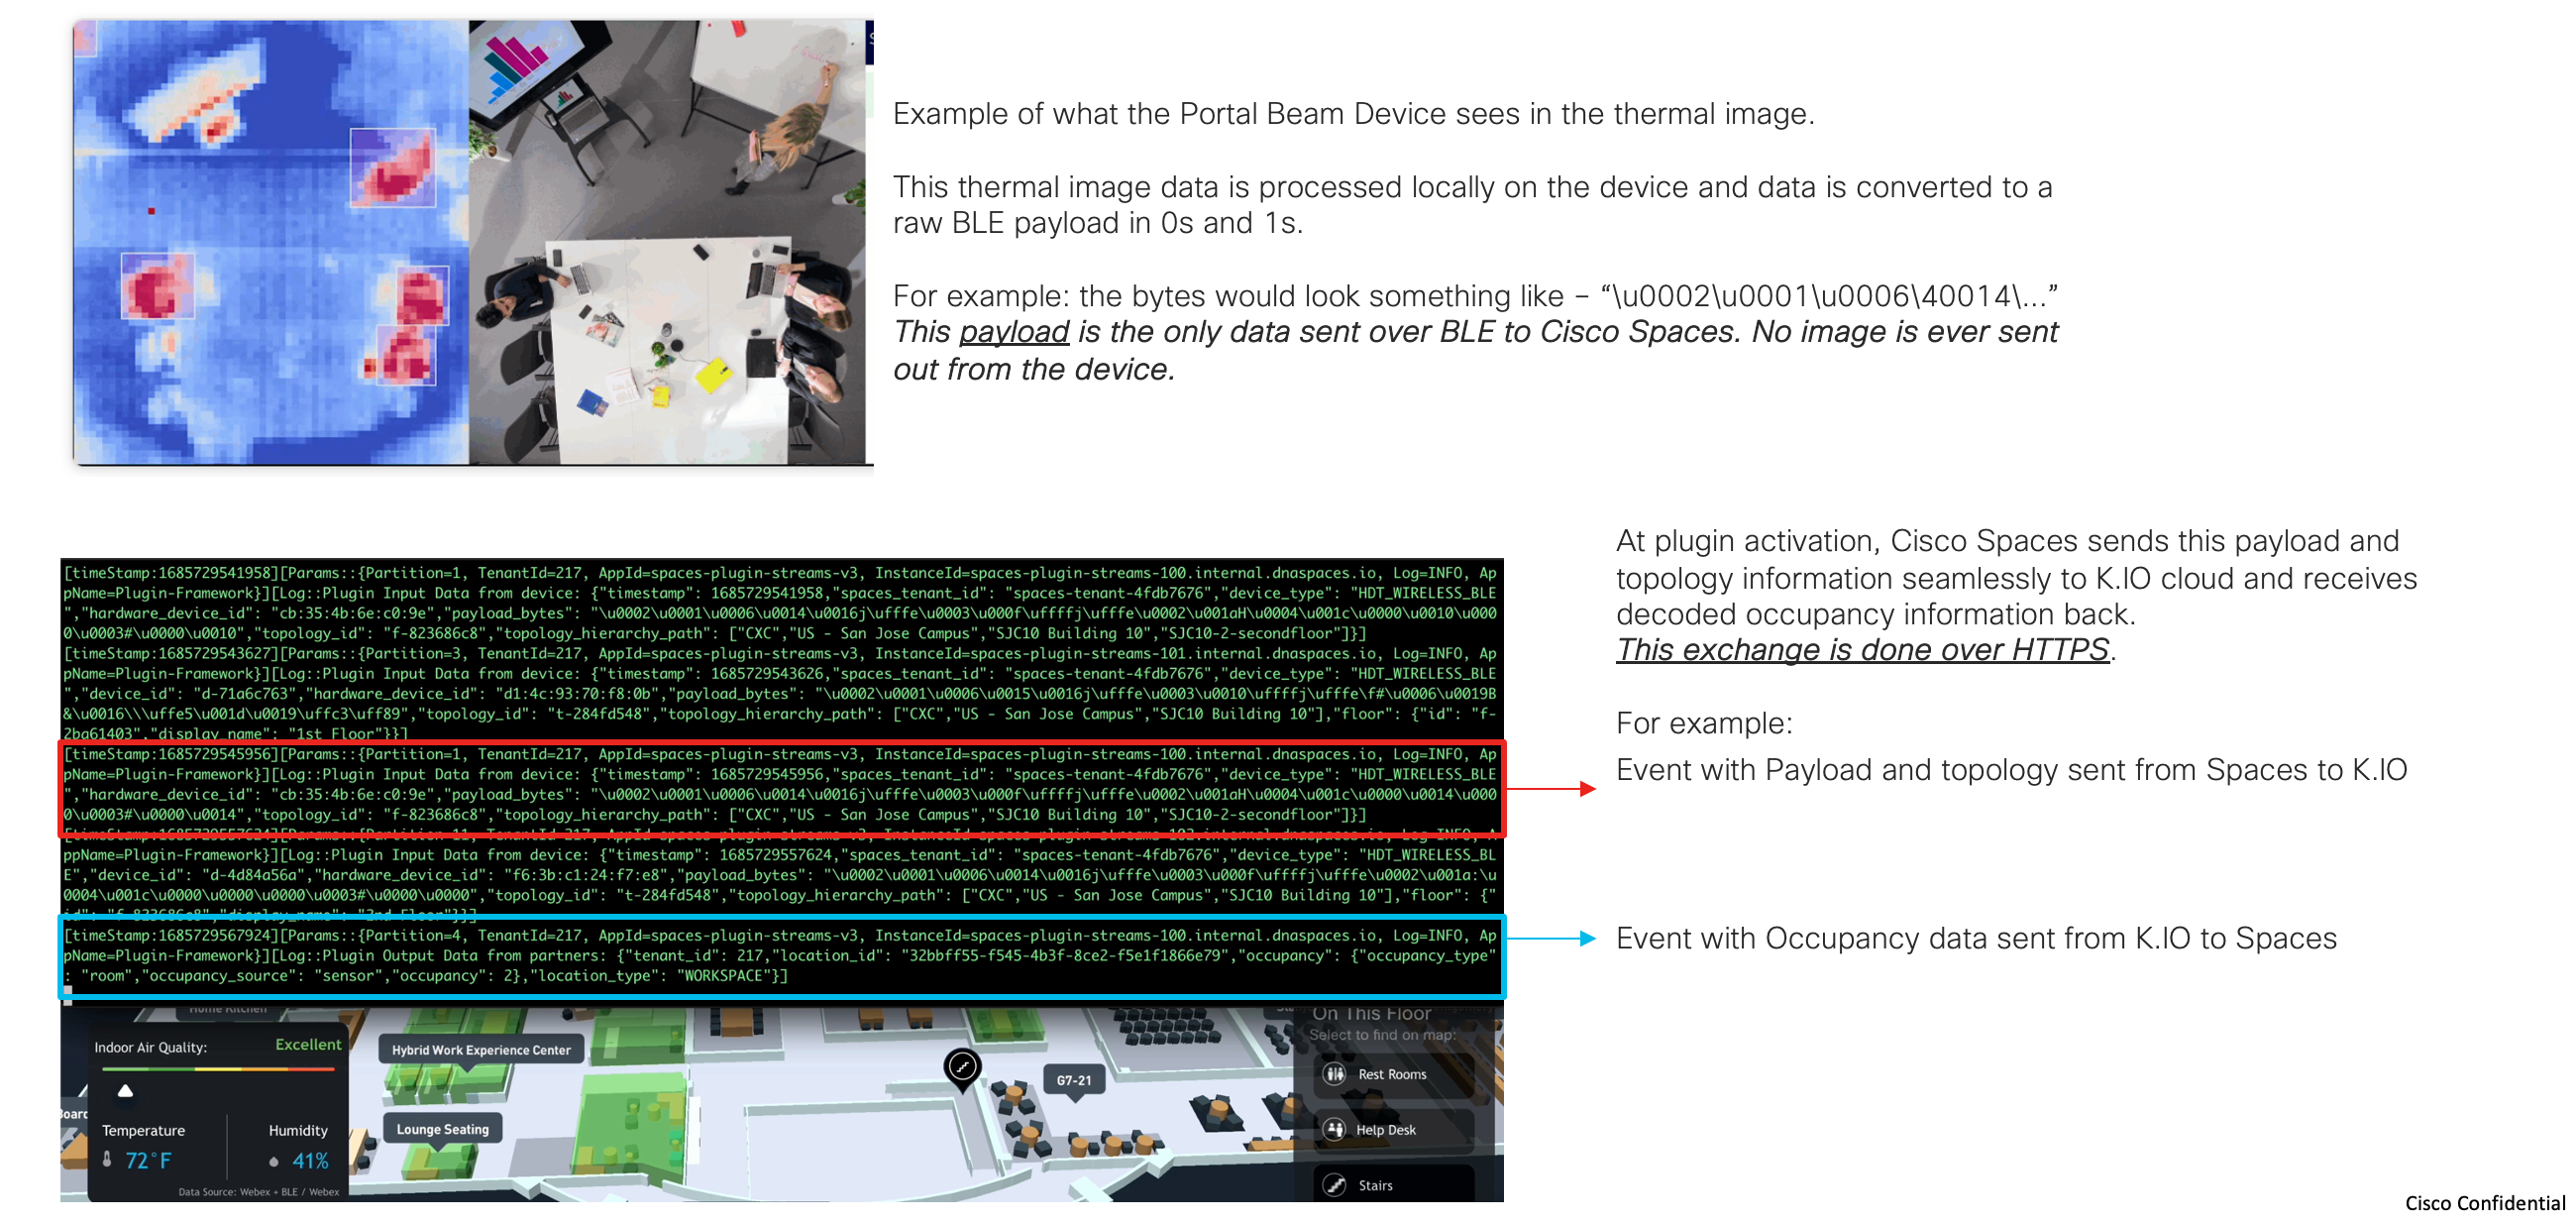
Using Kontakt's Kio Setup Manager mobile app, capture the Portal Beam's real-time thermal image. This image is a heatmap of the objects detected within its field of view allowing verification of the people detected and set Exclusion Zones.
Exclusion Zones are user-defined areas within the Portal Beam's field of view that are ignored by the http://Kontakt.io Occupancy Engine. These zones can include non-human, stationary objects with high background temperatures, such as TVs, light fixtures, windows, or other electrical equipment. Additionally, a zone can be a specific area within a large room where occupancy detection is not required.
Download the Kio Setup Manager mobile app. If the app is already obtained, be sure to check for updates.
To download the app, go to the App Store or Google Play. Search for Kio Setup Manager .
From the mobile device, open the Kio Setup Manager > from the Login Method options, tap Cisco Spaces.
Select the Region of the Cisco Spaces account.
United States (default)
Europe (EU)
Log in with the Cisco Spaces account credentials > select the account. All the needed permissions and enable BLE on the phone.
From the list of Nearby Devices, locate the Portal Beam by its Unique ID or MAC address .
Tap the Portal Beam to access its profile.
(Optional) To verify the Portal Beam selected, tap Flash LED. From its front-side, a BLUE colored LED flashes briefly.
It's recommended to apply available firmware updates. Be sure allow a firmware update to complete before proceeding to the next step.
Android: from the bottom section of its profile, if a Firmware Update button is displayed, tap this now to apply to the firmware update.
iOS: from the top section of its profile, review the Pending Operation section. If Update to Firmware is displayed, tap this now to apply the firmware update.
From its Troubleshooting section, tap Verify Thermal Camera > tap Capture Image.
From the captured image's heatmap, verify the objects detected.
If there are any non-human, stationary hot objects detected or areas wanted to be excluded from occupancy detection, configure these as exclusion zones. It's recommended to set windows as exclusion zones, especially when direct sunlight enters the area through a window.
Exclusion Zone examples:
The following Portal Beam thermal images show how Exclusion Zones can be set to exclude objects or areas from occupancy detection. Each exclusion zone is outlined in red.
Hot objects: wall-mounted TV and window excluded from occupancy detection.
Captured thermal image | TV and window set to exclusion zones |
Large room: two specific areas excluded from occupancy detection.
Captured thermal image | Two areas set to exclusion zones |
From the top section of the image, tap the cloud icon.
The image is uploaded to the Portal Beam's Occupancy settings within the Device Kontakt Management Plugin. This image is a helpful troubleshooting resource.
Step 6 - Associate Portal Beam to the workspace (Room) in Space Manager Application
This step results visually experiencing the Portal Beam's real-time room occupancy and environmental data from Spaces Digital Maps
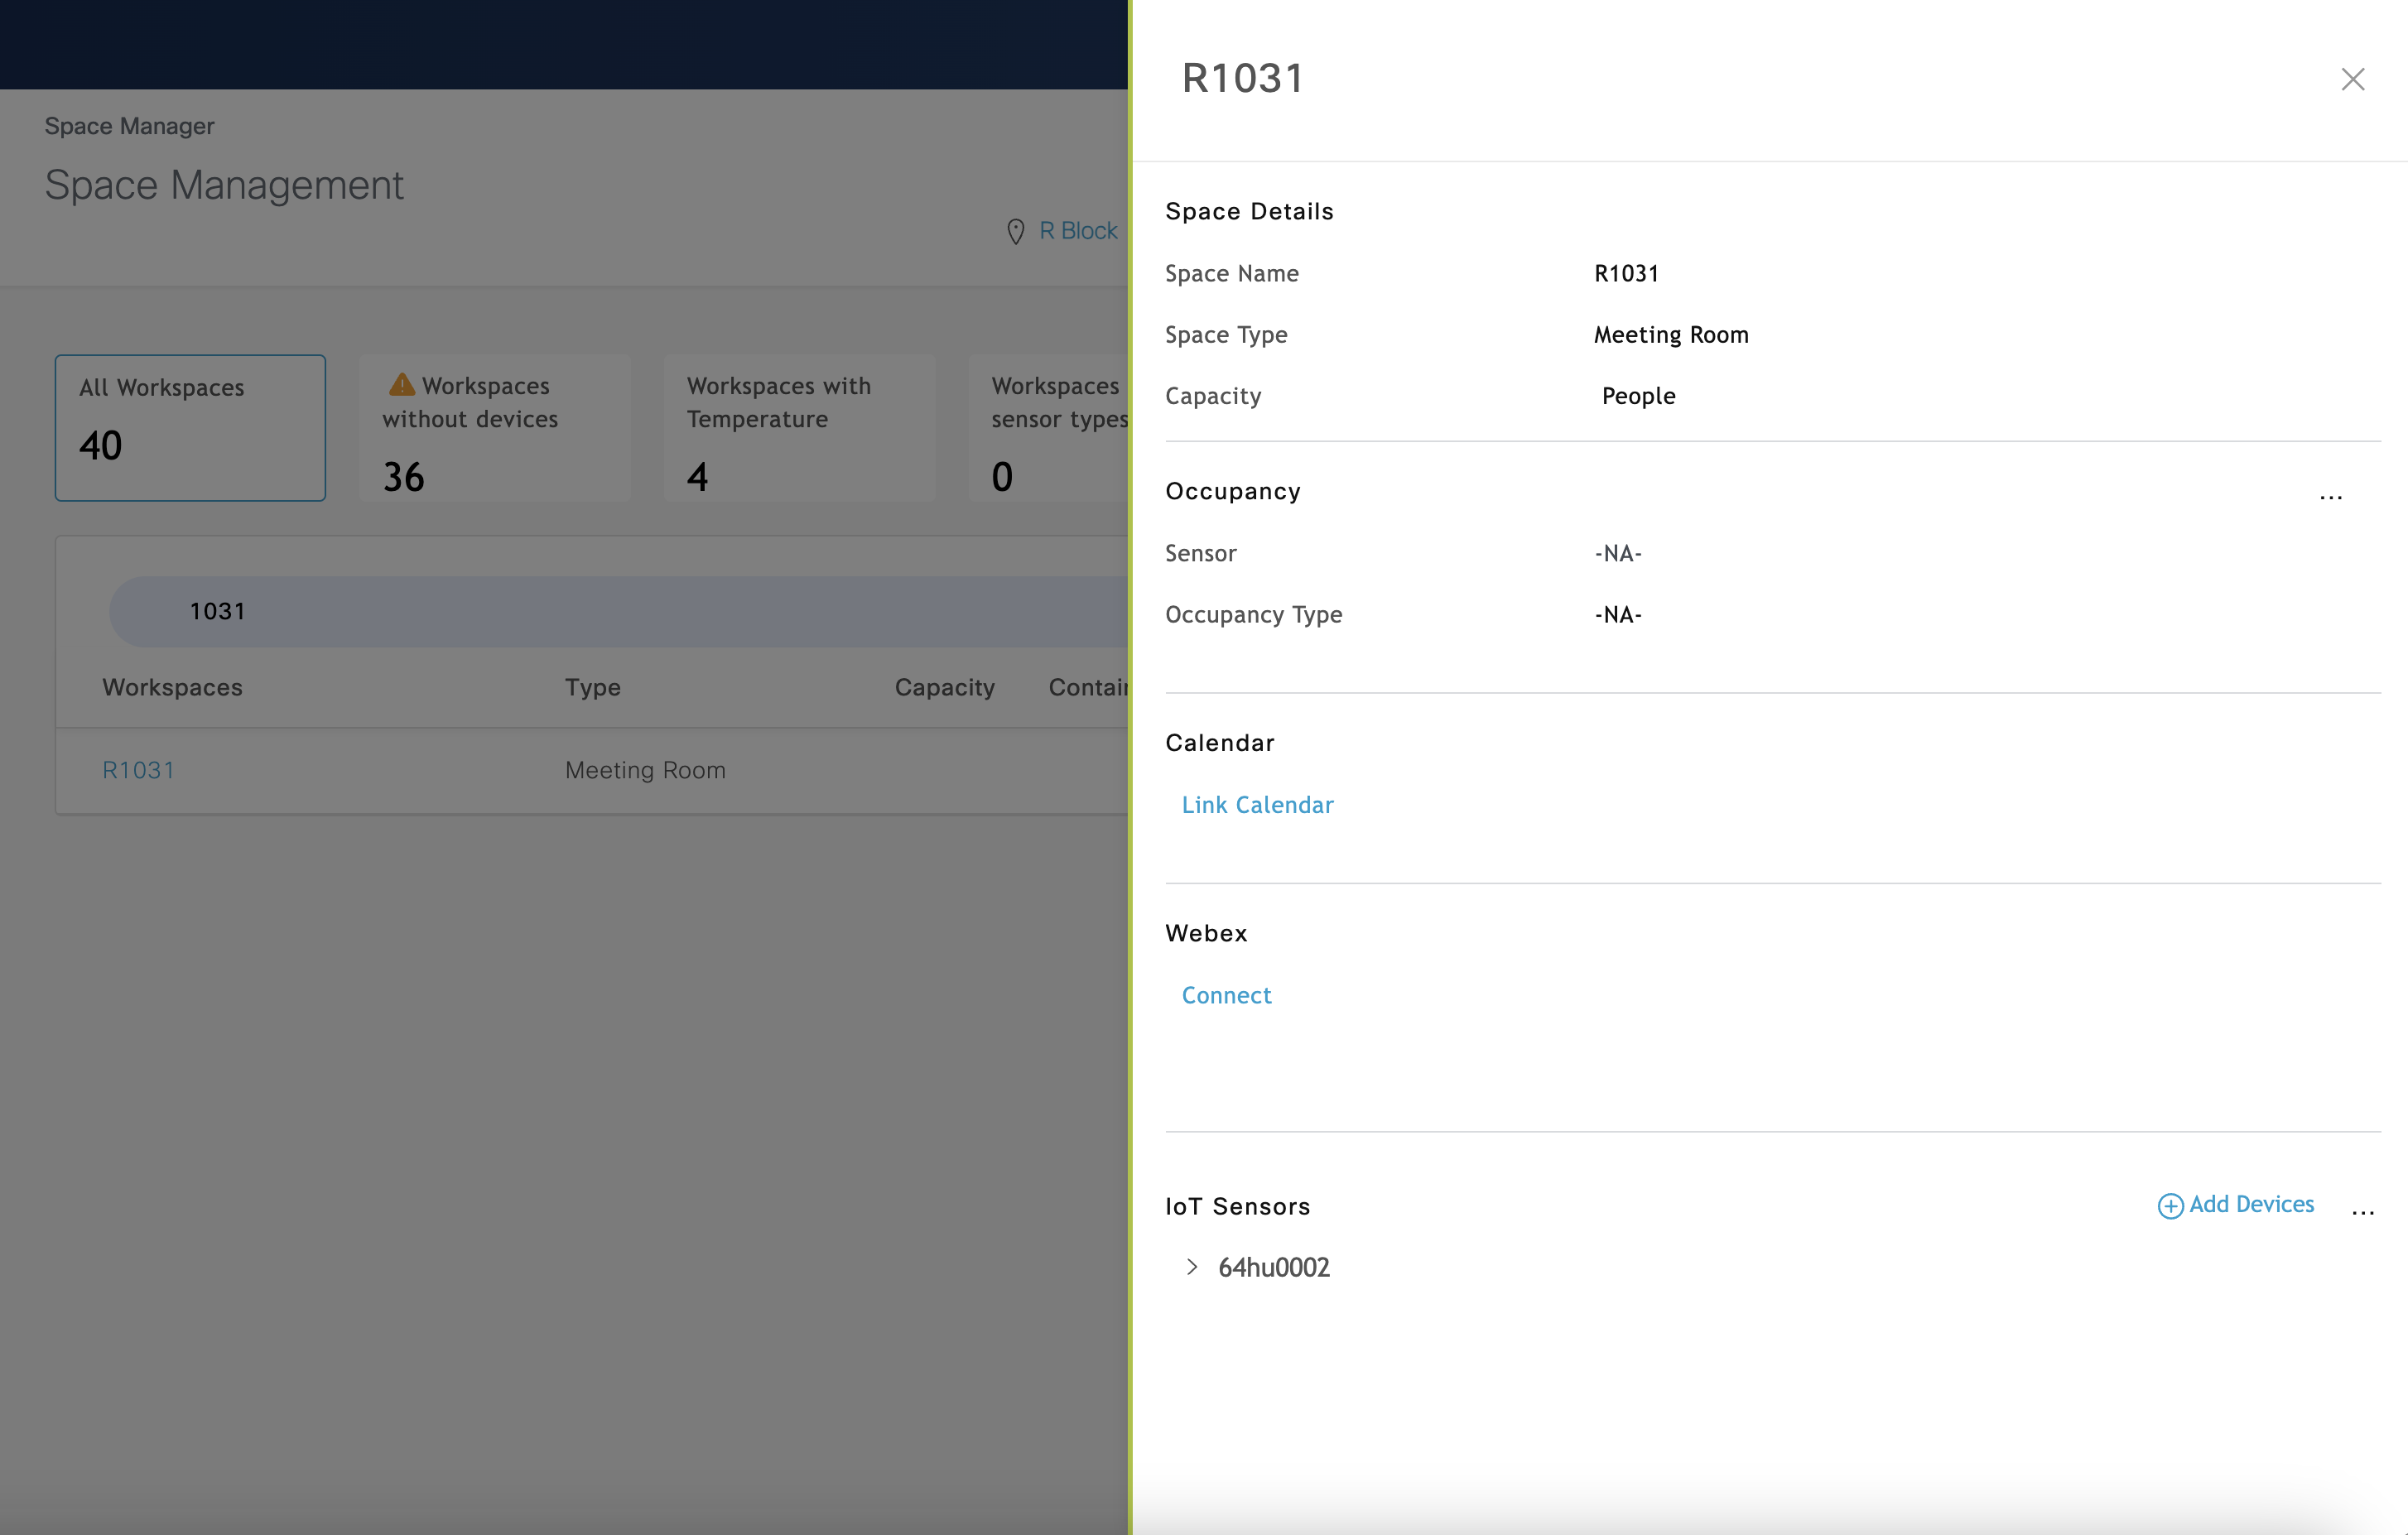
From the Cisco Spaces Home page, navigate to the Space Manager app.
Go to Space Management > locate and select the workspace where the Portal Beam is installed.
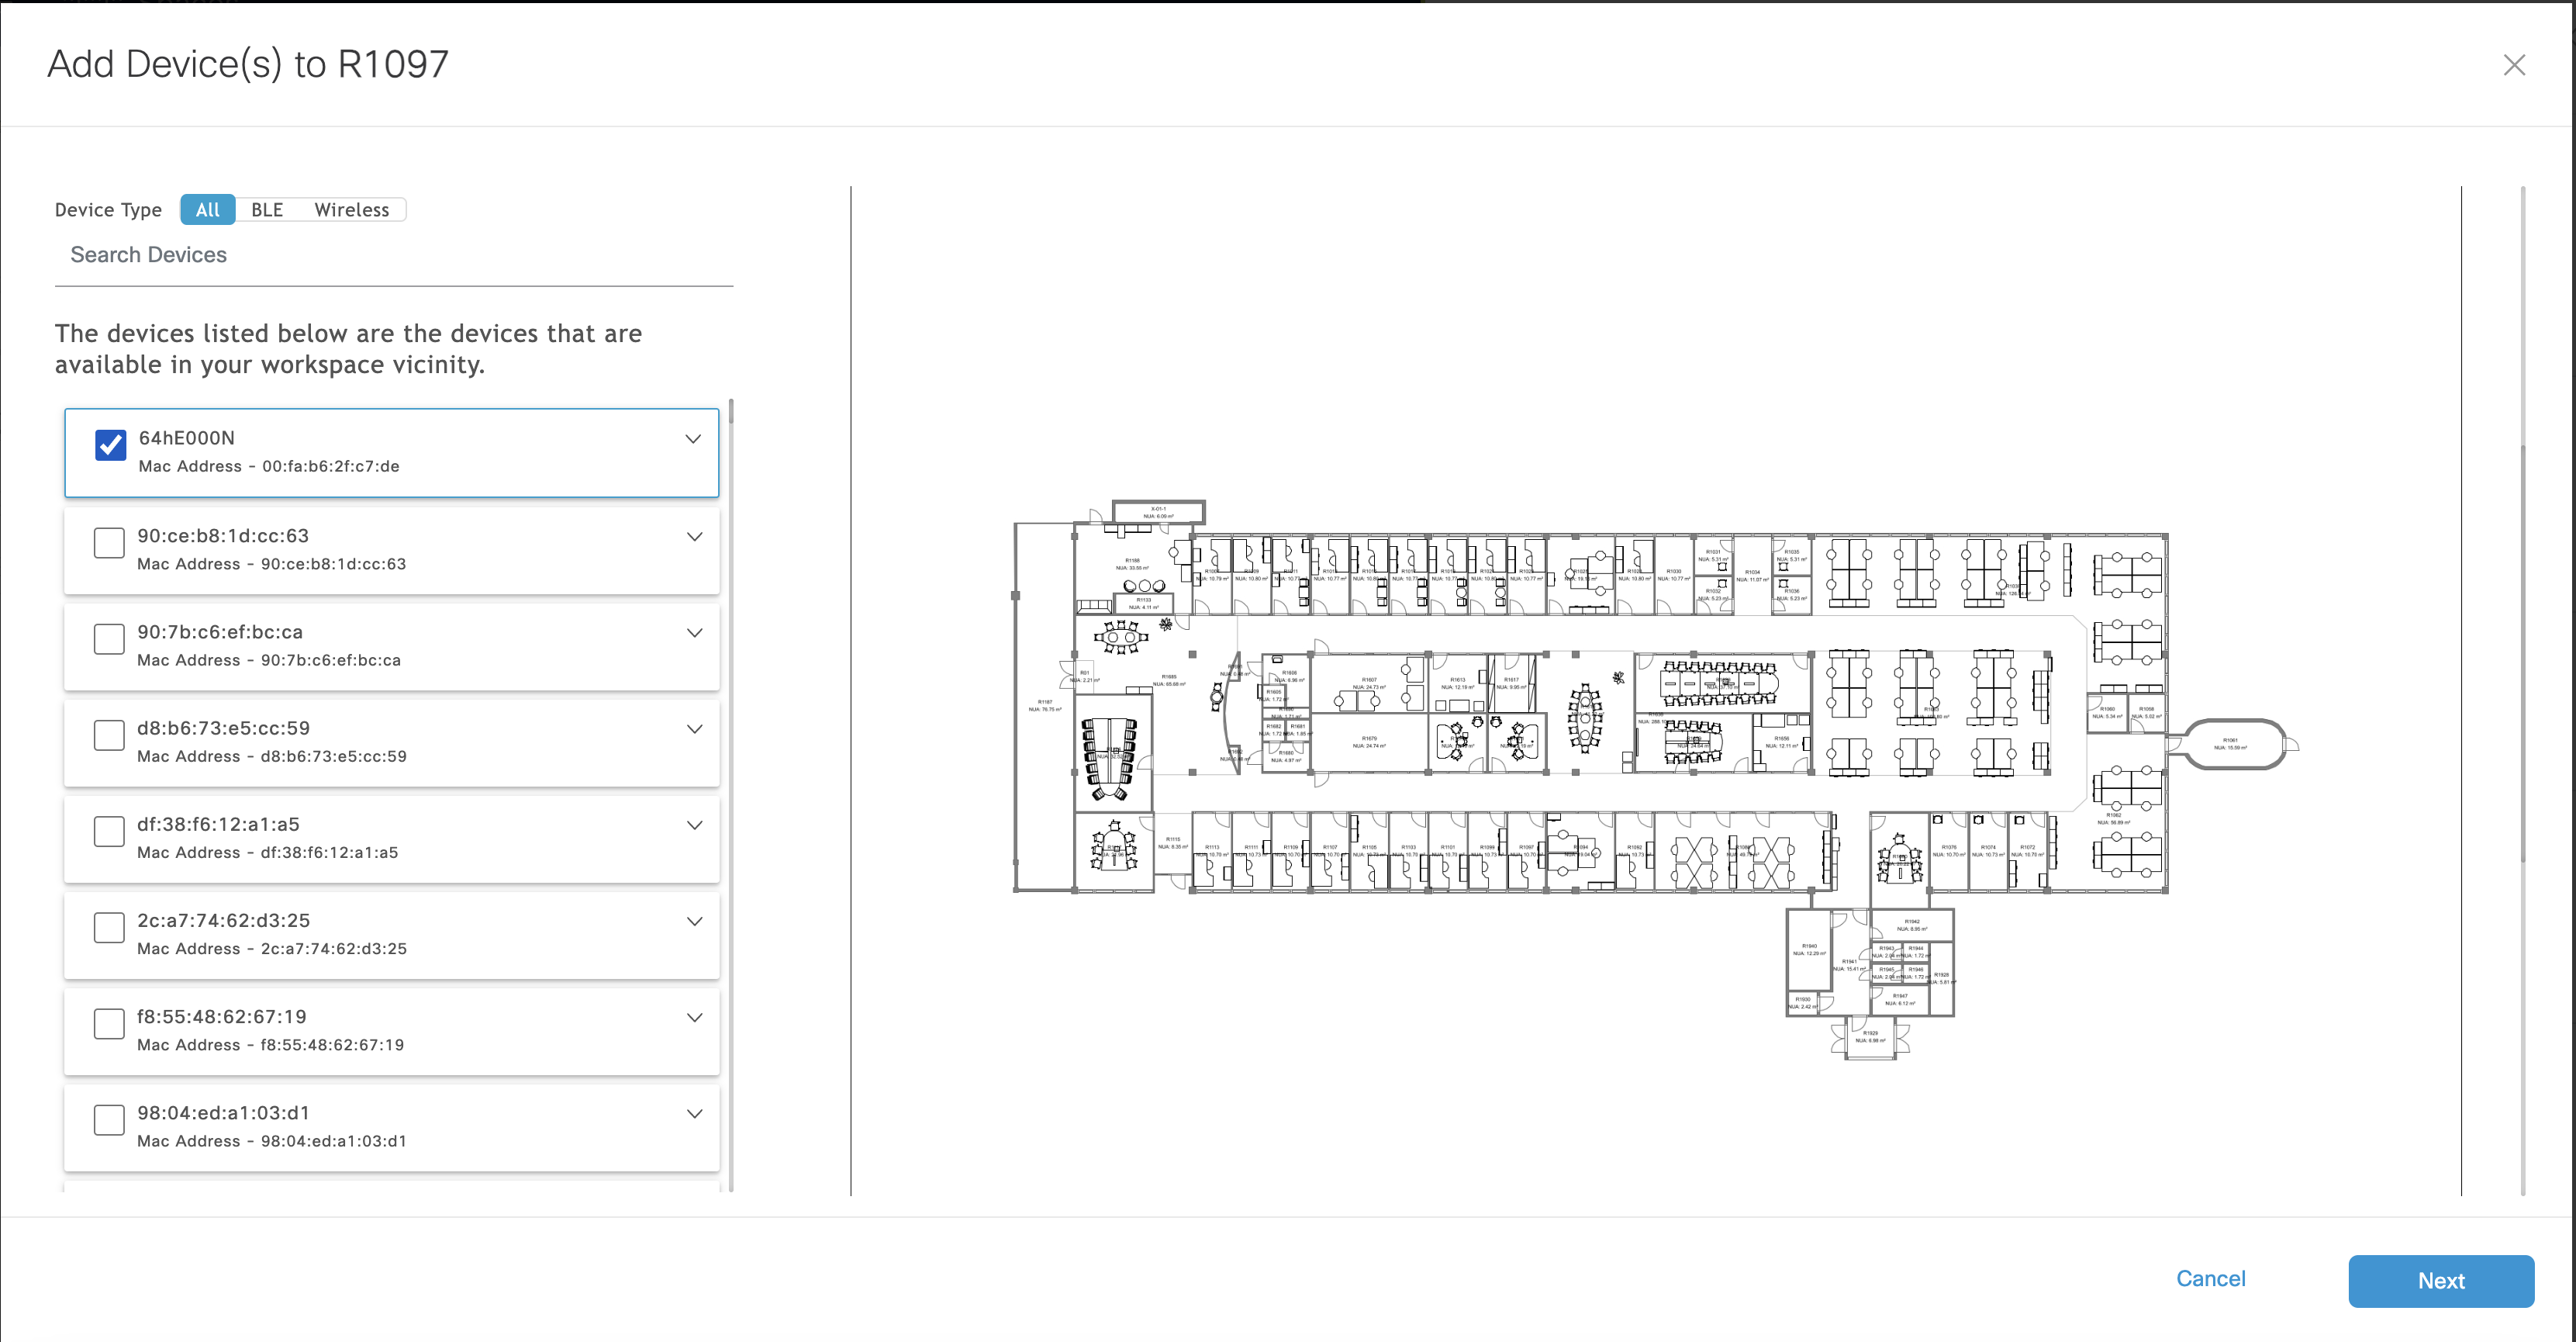
From the workspace's profile, go to the IoT sensors section, select Add Devices.
From the Service Type, select BLE.
From the list, select the Portal Beam > select Next to associate the beam to the workspace.
Step 7 - Add room occupancy capacity
At this time, ability to add room occupancy capacity is currently limited. Please reach out to Spaces support or PM team with the room names and the room capacities for Cisco to add these from the backend.
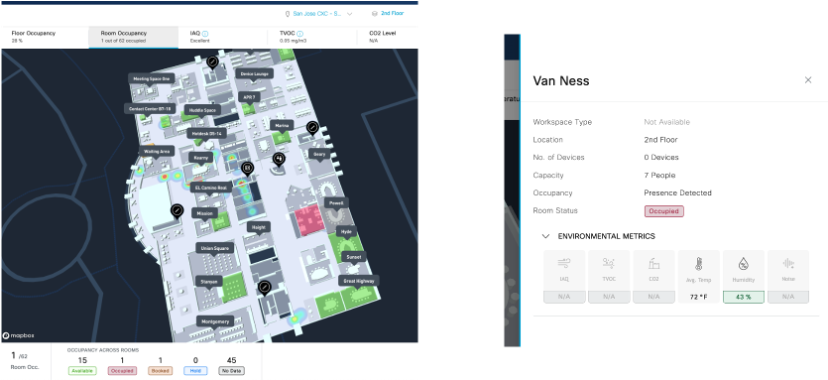
Step 8 - Validate Portal Beam outcomes on Digital Maps
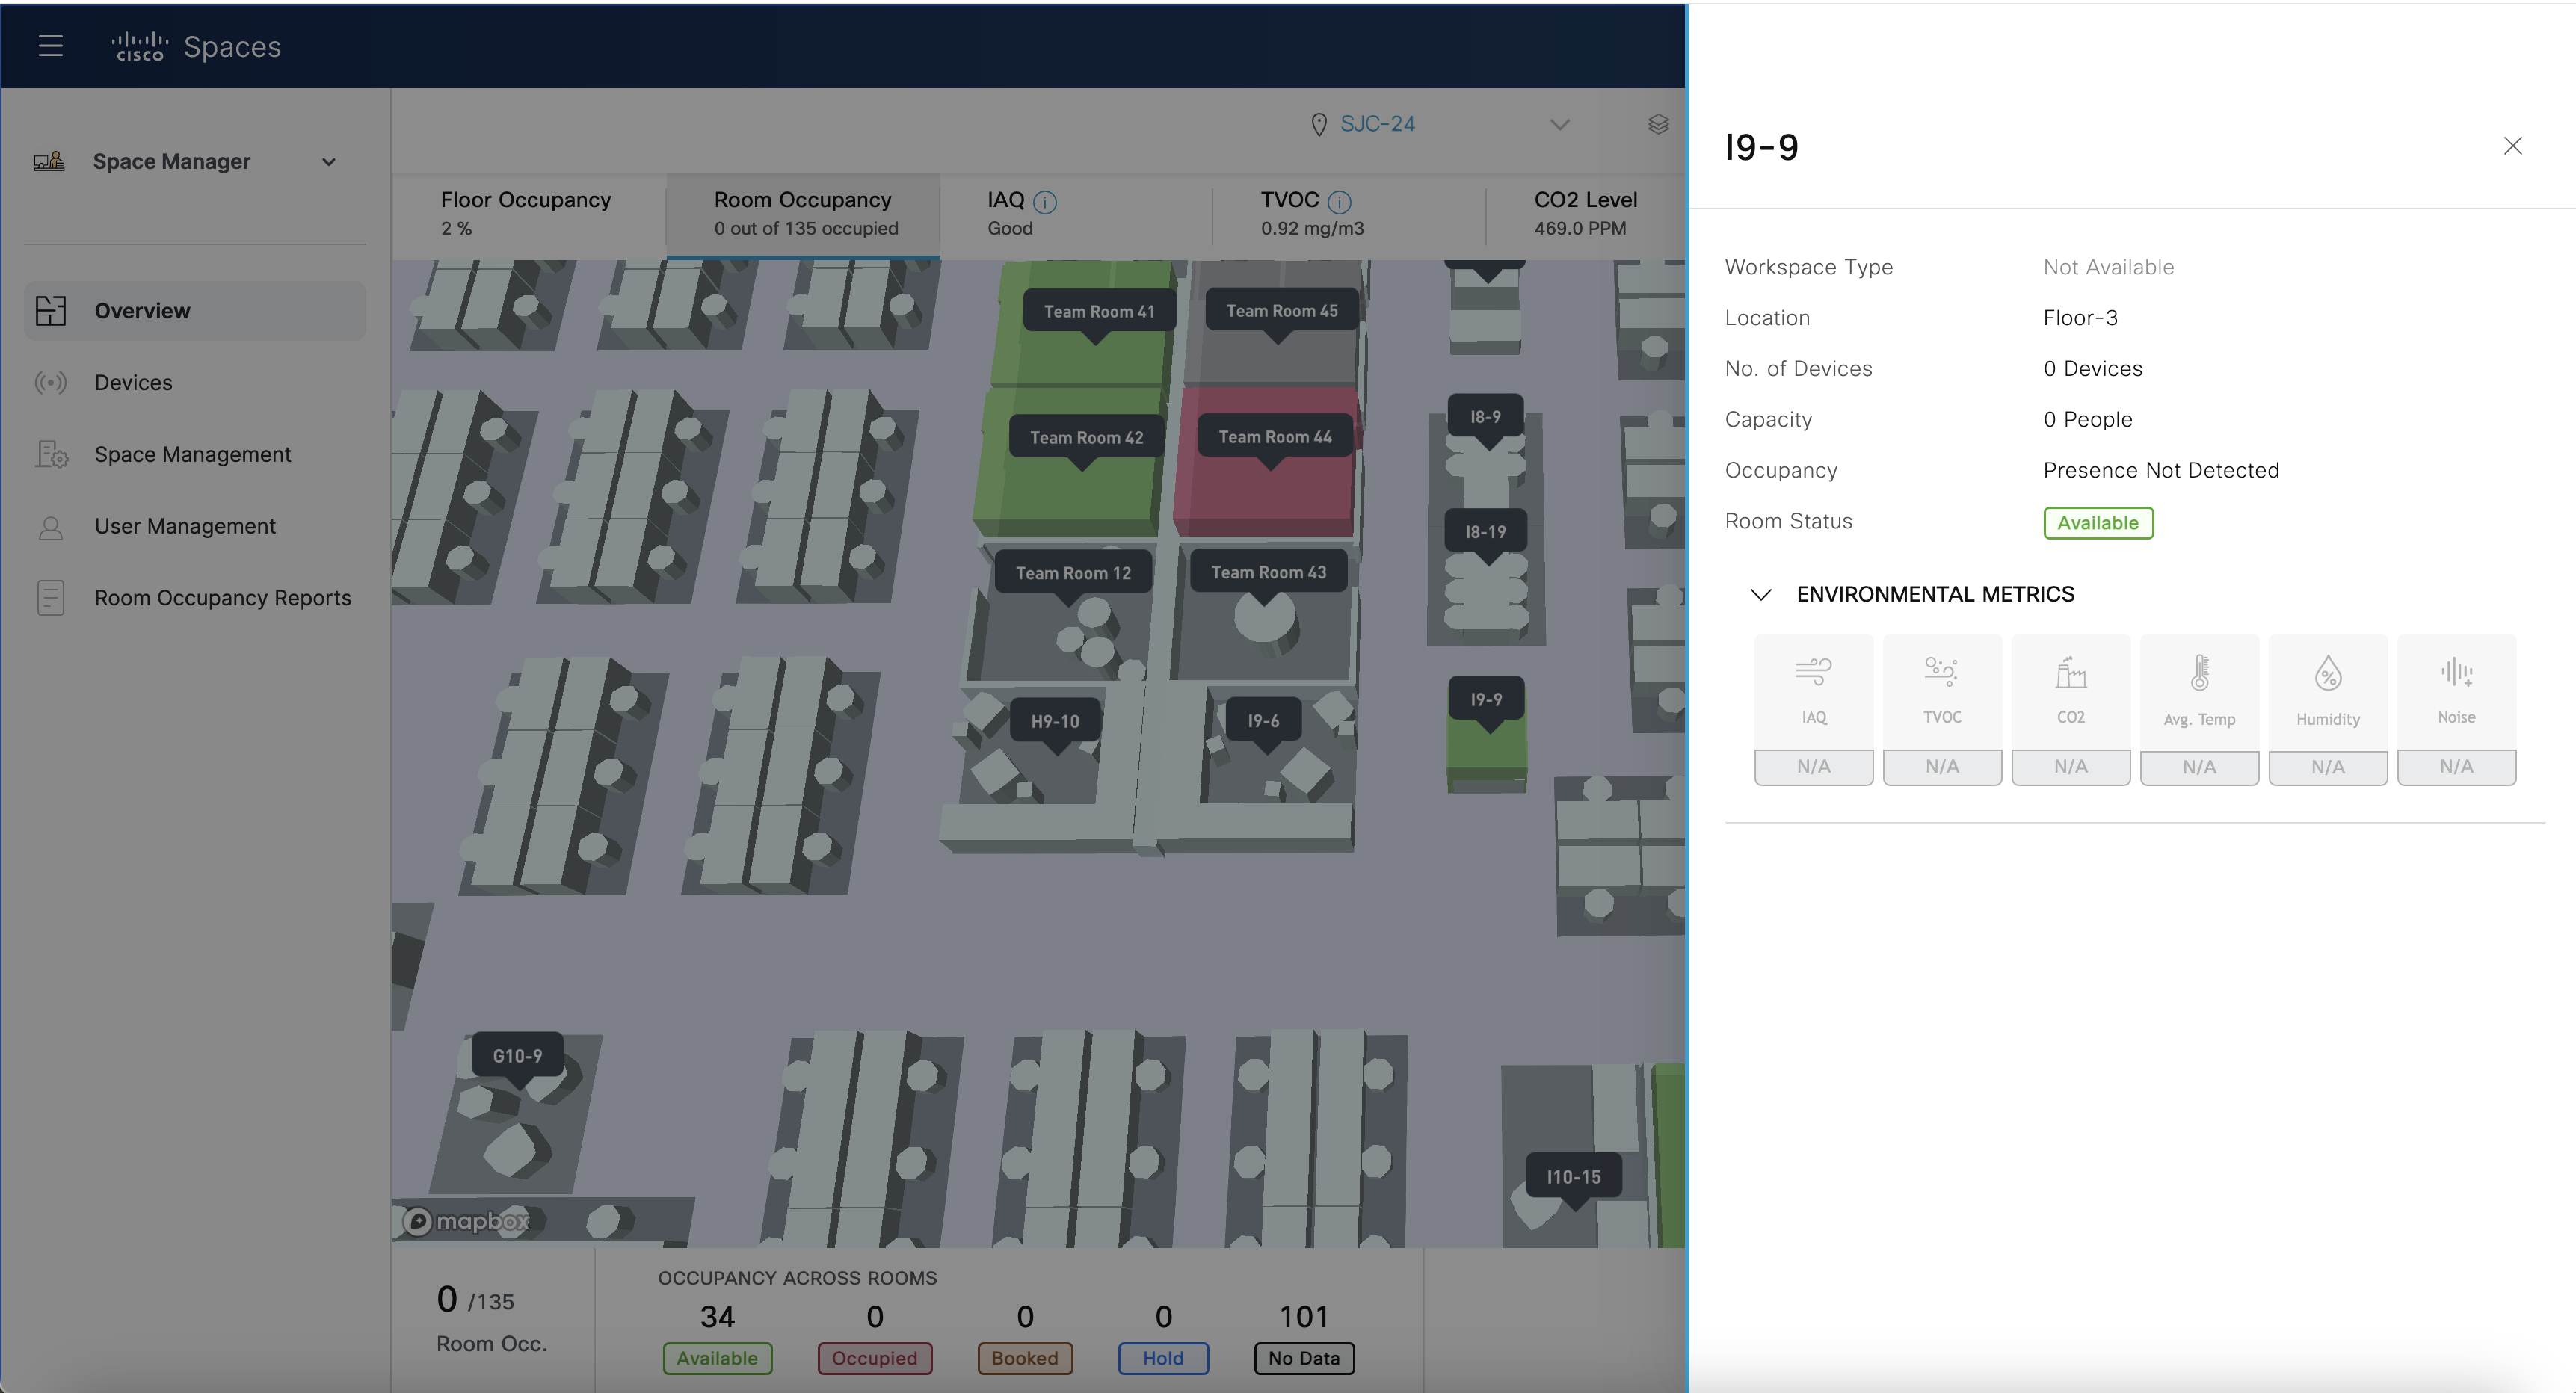
As the final deployment step, we recommend validating the Portal Beam outcomes from the Digital Maps. Complete this at the room location where the Portal Beam is mounted and will require two people.
From the Cisco Spaces home page, navigate to the Space Manager app. Navigate to the correct floor and select the Room Occupancy option. All the rooms can be seen with the associated sensors and their real time
Validation steps (complete at the Portal Beam's room-level location) | Expected outcome |
|---|---|
| Room occupancy counts are accurate.
Sensor/temperature readings are accurate. |
Step 8 - Enable Digital Kiosk Outcome
Once the devices are correctly added and validated, customers can use the device data to feed into the Kiosk application. Refer to the Kiosk section within the relevant guides to understand the steps needed.
Data Flow and Data Security
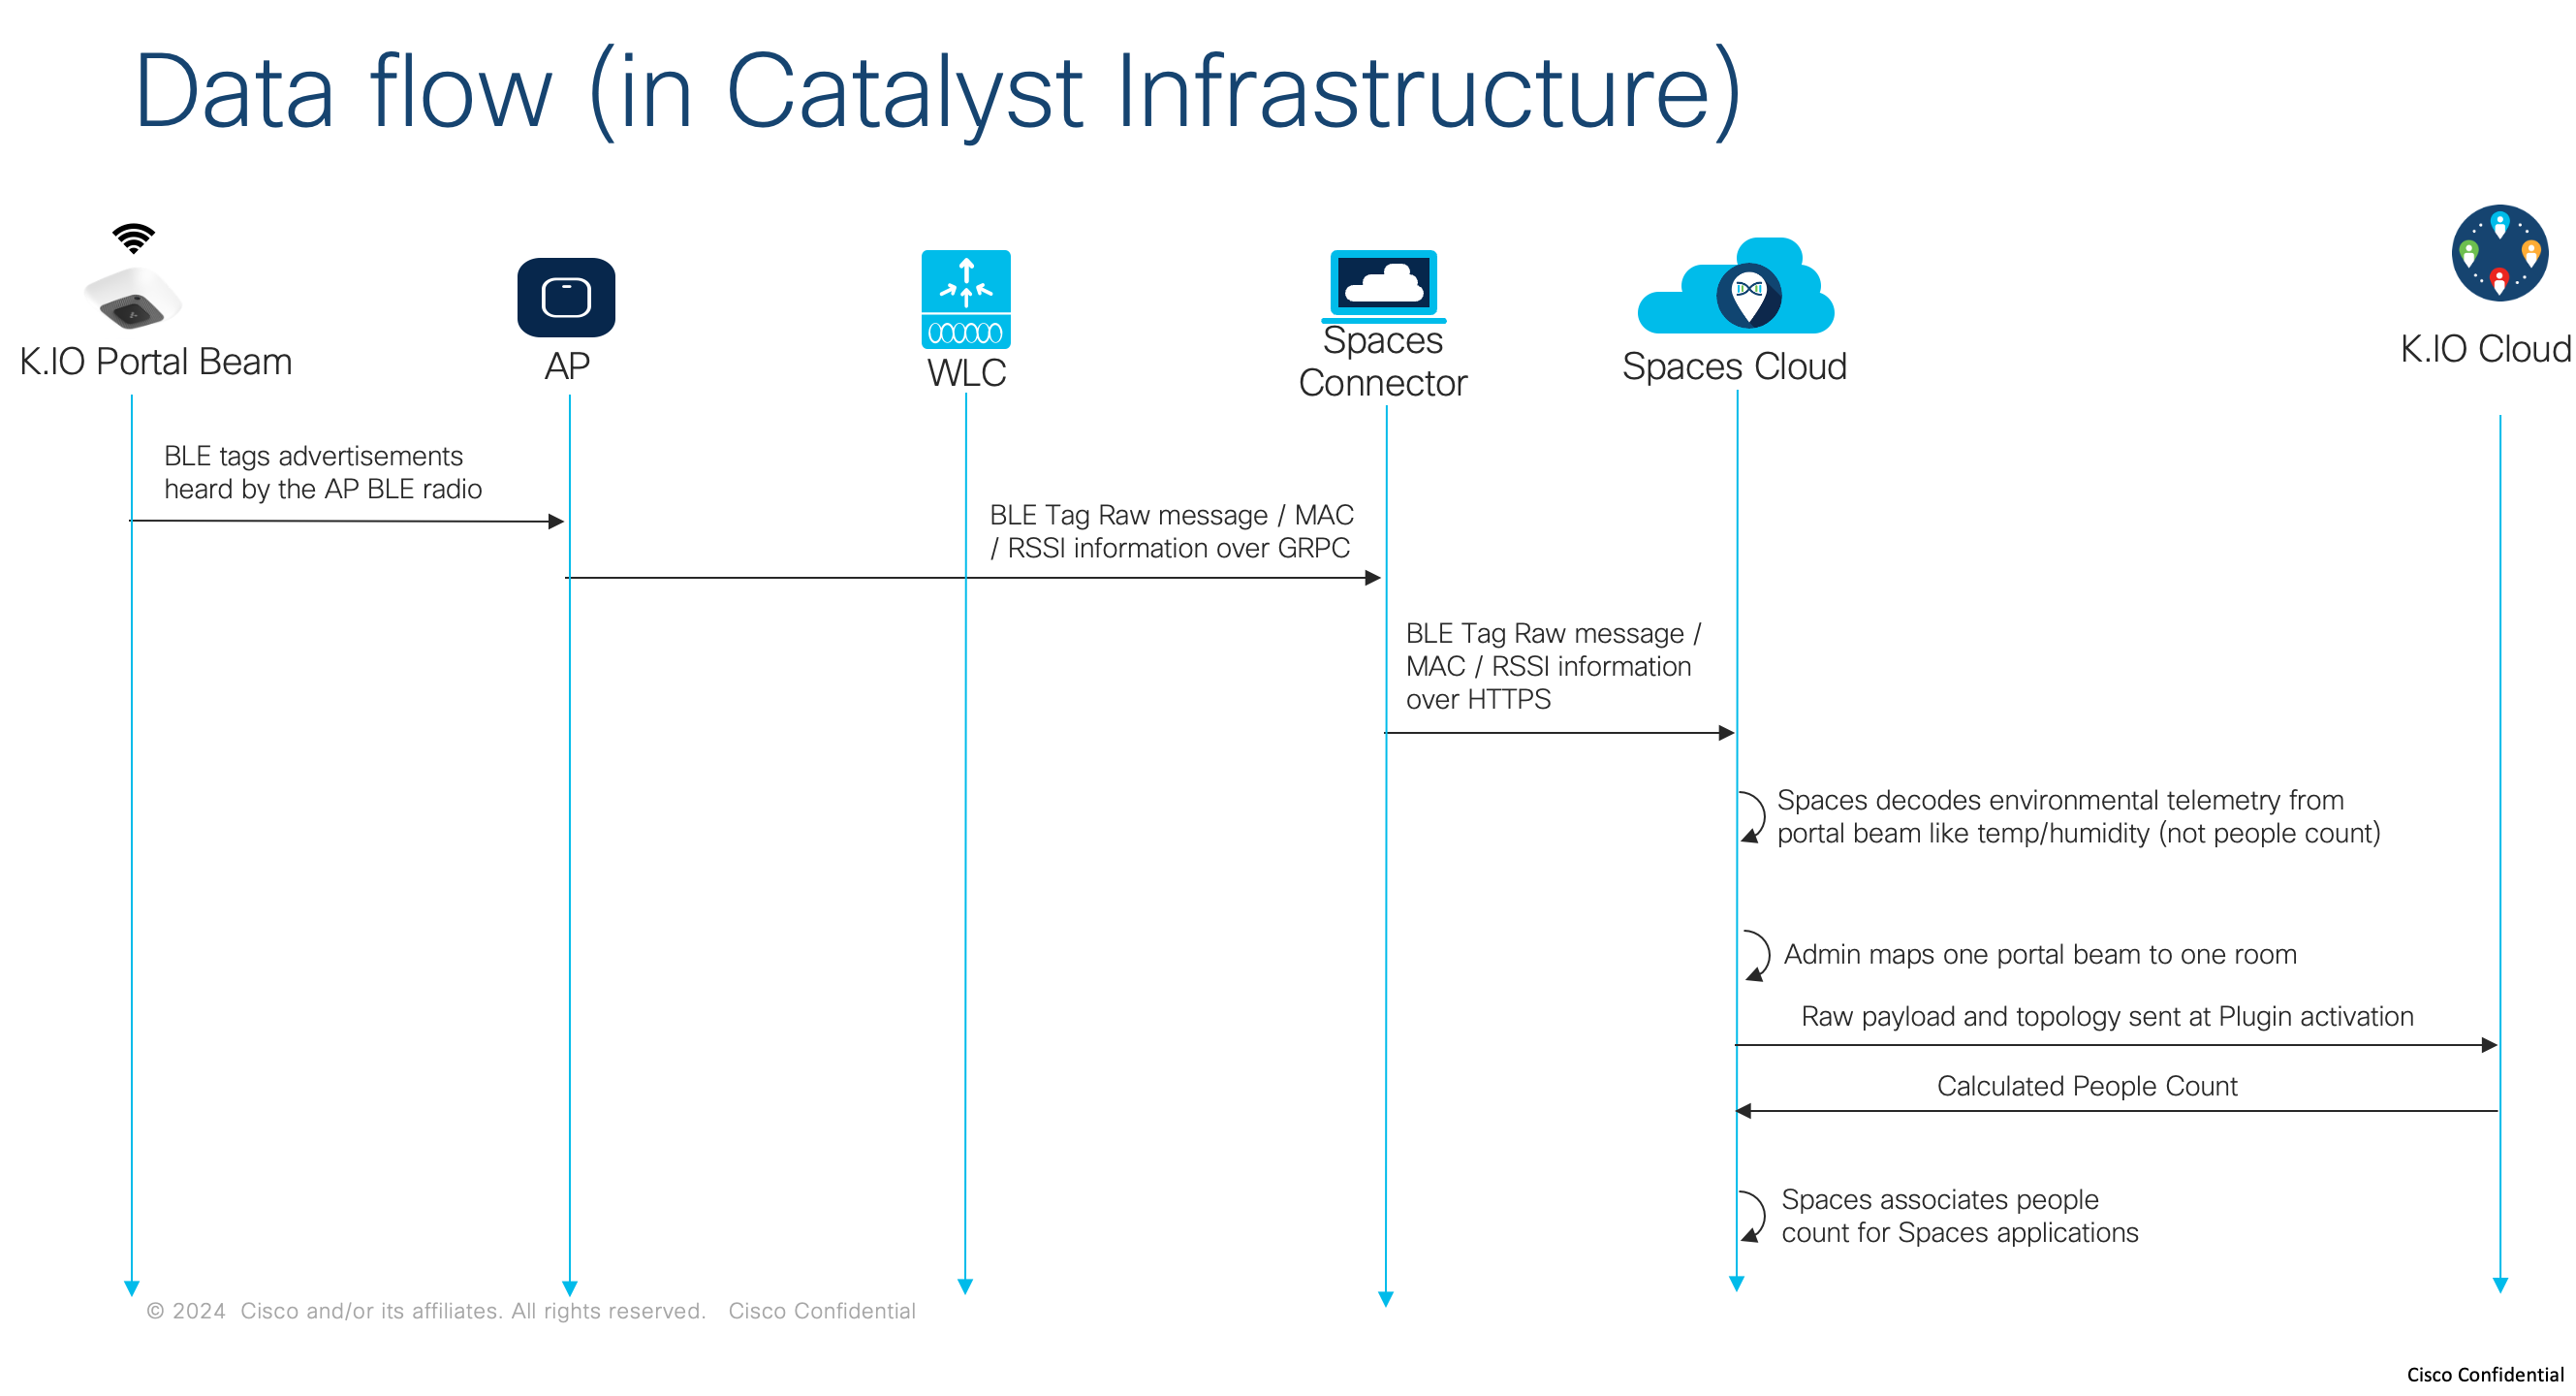
Data Flow Diagram
No image or PII data is ever leaving the device or sent to the cloud
Best Practices
For Cisco Spaces + Portal Beam solution, Cisco recommends the following best practices.
Make sure all infrastructure release versions and AP deployment modes are used. For example, if older IOS-XE code or a connector with a lower than recommended resources are used, customers may run into known and unpredictable BLE behavior. It will directly impact any BLE based outcomes
Follow all Cisco recommended best practices for location grade deployment, including but not limited to APs installed at the periphery of the floors, no more than 50 feet of inter AP distance, devices heard at least -75dbm or better by at least 3 APs.
Make sure IoT Services and location (Detect and Locate) is working for the account and location properly as it is a inherently used by the plugin framework.
Make sure devices are either installed by Kontakt official installers, or in conjuction with Kontakt support and guidance and follows all Kontkat best practices published.
Understand and explain to customers the unsupported and supported functionality to set right expectations.

Example - Portal Beam in middle of the room centered around the seating area
Example - Portal Beam in middle of the room centered around the seating area
For Cisco Spaces + Portal Beam solution, Cisco recommends the following best practices.
Make sure all infrastructure release versions and AP deployment modes are used. For example, if older IOS-XE code or a connector with a lower than recommended resources are used, customers may run into known and unpredictable BLE behavior. It will directly impact any BLE based outcomes
Follow all Cisco recommended best practices for location grade deployment, including but not limited to APs installed at the periphery of the floors, no more than 50 feet of inter AP distance, devices heard at least -75dbm or better by at least 3 APs.
Make sure IoT Services and location (Detect and Locate) is working for the account and location properly as it is a inherently used by the plugin framework.
Make sure devices are either installed by Kontakt official installers, or in conjuction with Kontakt support and guidance and follows all Kontkat best practices published.
Understand and explain to customers the unsupported and supported functionality to set right expectations.
Example - Portal Beam in middle of the room centered around the seating area
Example - Portal Beam in middle of the room centered around the seating area
Troubleshoot Portal Beam Room Occupancy
If issues are seen with the occupancy counts, or need to verify a Portal Beam’s people detection capability, use the Kio Setup Manager mobile app, downloaded from either App Store or Play Store. If these actions do not resolve the issue, please open a support ticket.
Capture real time thermal image to verify people detection.
Repeat Step 5 from the workflow to make sure the functionality is working correctly.
Configure or update the exclusion zones.
Repeat Step 5 from the workflow to make sure the functionality is working correctly.
View the last image shared from Cisco Spaces
Go to links mentioned in Step 3 from the workflow and validate the image is seen correctly for the appropriate Portal Beam.
Update device firmware
Use either Kio Setup Manager mobile app or Cisco Spaces to upgrade the firmware on the Portal Beam, if available. If using the mobile app, a blue up arrow icon
displayed next to a Portal Beam indicates that a firmware update is available. Be sure to allow enough time for any firmware update to be completed.
Validate IOT Services
Refer to Cisco Spaces documentation or leverage Cisco TAC support to make sure IOT Services is working correctly.
Portal Beam Checklist Form
The form here is to ensure proper readiness for the occupancy outcome using portal beams prior to deployment.
Room (PIR Presence)
What is PIR sensor ?
A PIR (Passive Infrared) sensor is a motion detection device that senses infrared light radiating from objects in its field of view. It’s commonly used in applications to detect movement of people in workspace environments.
Use case : PIR sensor-based presence use case for workspaces
PIR sensors will only support a binary value of occupied or unoccupied results.
The following sensors are supported for Cisco Spaces outcomes.
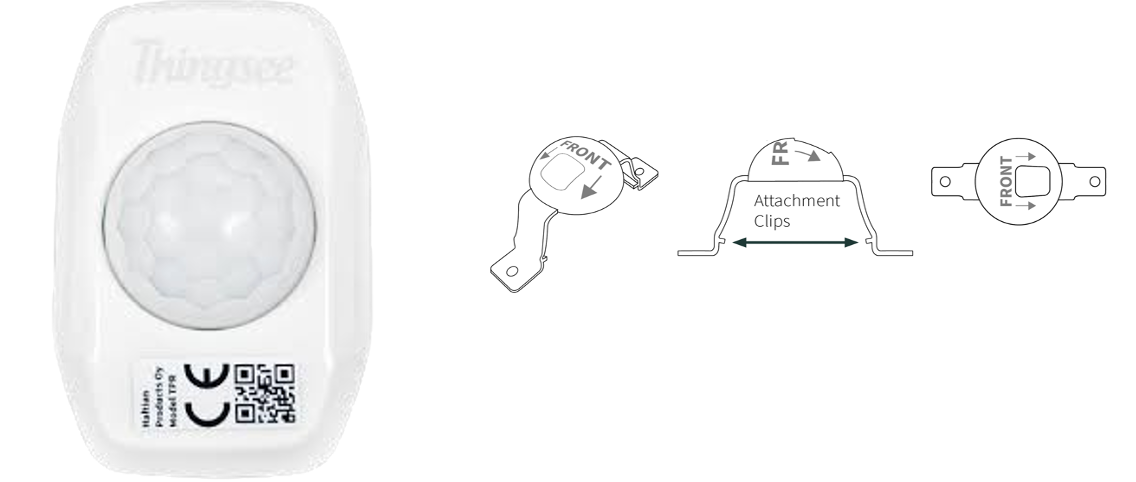
Thingsee PIR sensor with Dome
Thingsee Prerequisites
Area | Pre-requisites |
Wireless infra |
|
| |
Spaces infra | Cisco Spaces Connector 3.1 Virtual Machine (VM) with internet access to Spaces Cloud endpoints (firewall allow list and proxy requirements) |
Enable IoT Services - Advanced BLE Gateway enabled – BLE Scan Mode (iBeacon) enabled (minimum requirement) Dual mode is fine but only Transmit Mode is not supported | |
Provide accurate CAD .dwg files for each floor in the EFT location (Best Practices - including walls, furniture, room labels/IDs, and other recognizable points of interest) | |
PIR Sensor | PIR Order should be in Place |
Please ensure with Vendor that the sensors you are ordering does have Cisco specific Firmware on them. Minimum 50 sensors are required to be ordered via IOT Marketplace.
How to Order PIR Sensor
For Thingsee PIR Sensor please navigate to Spaces IOT Marketplace and log in with linkedin or Spaces Credentials
Find Thingsee Presence sensor from Haltian and click on the Contact Vendor option and fill up the form pops up after that on the right side.
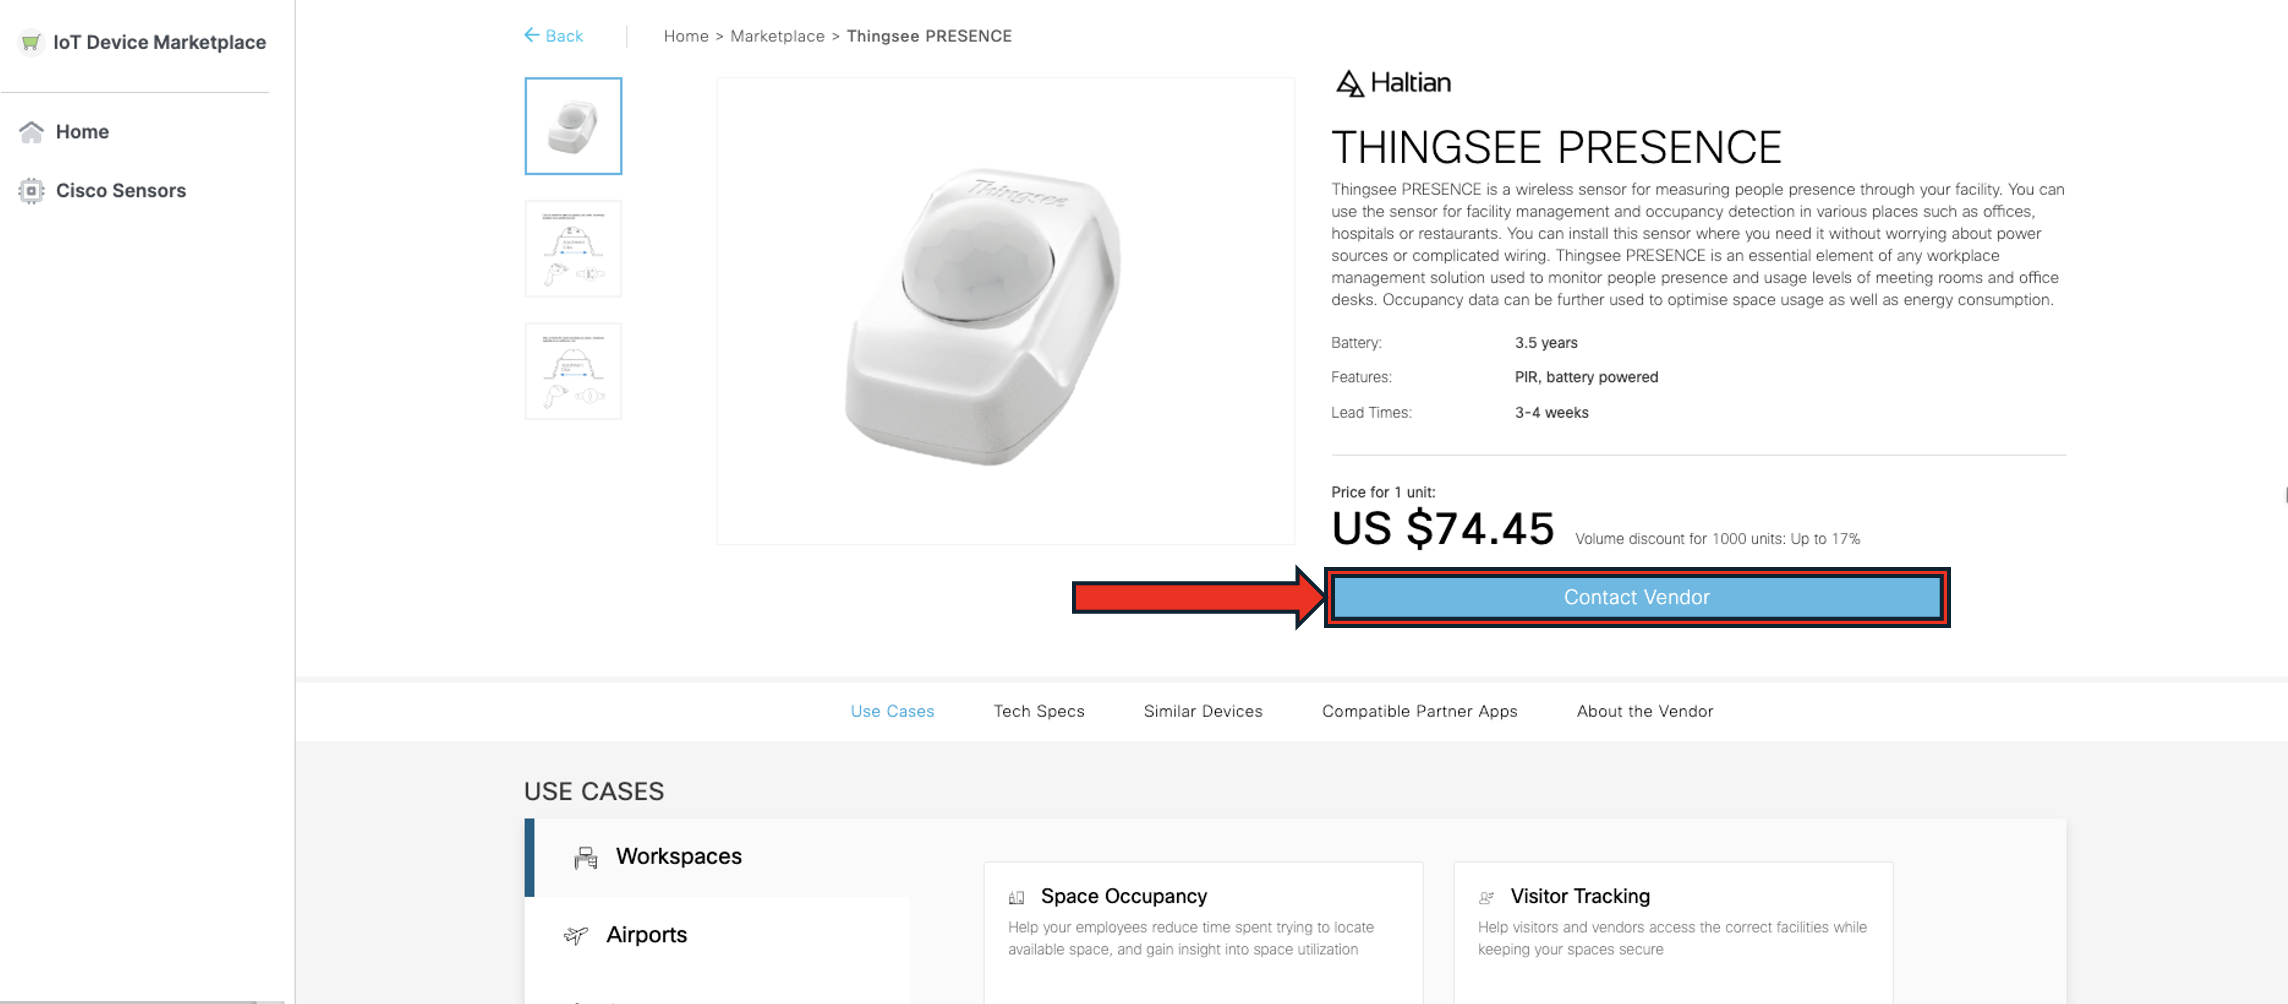
Fill in the information and mention the intent to order Thingsee sensors with Cisco Specific firmware in the Message section and submit it.
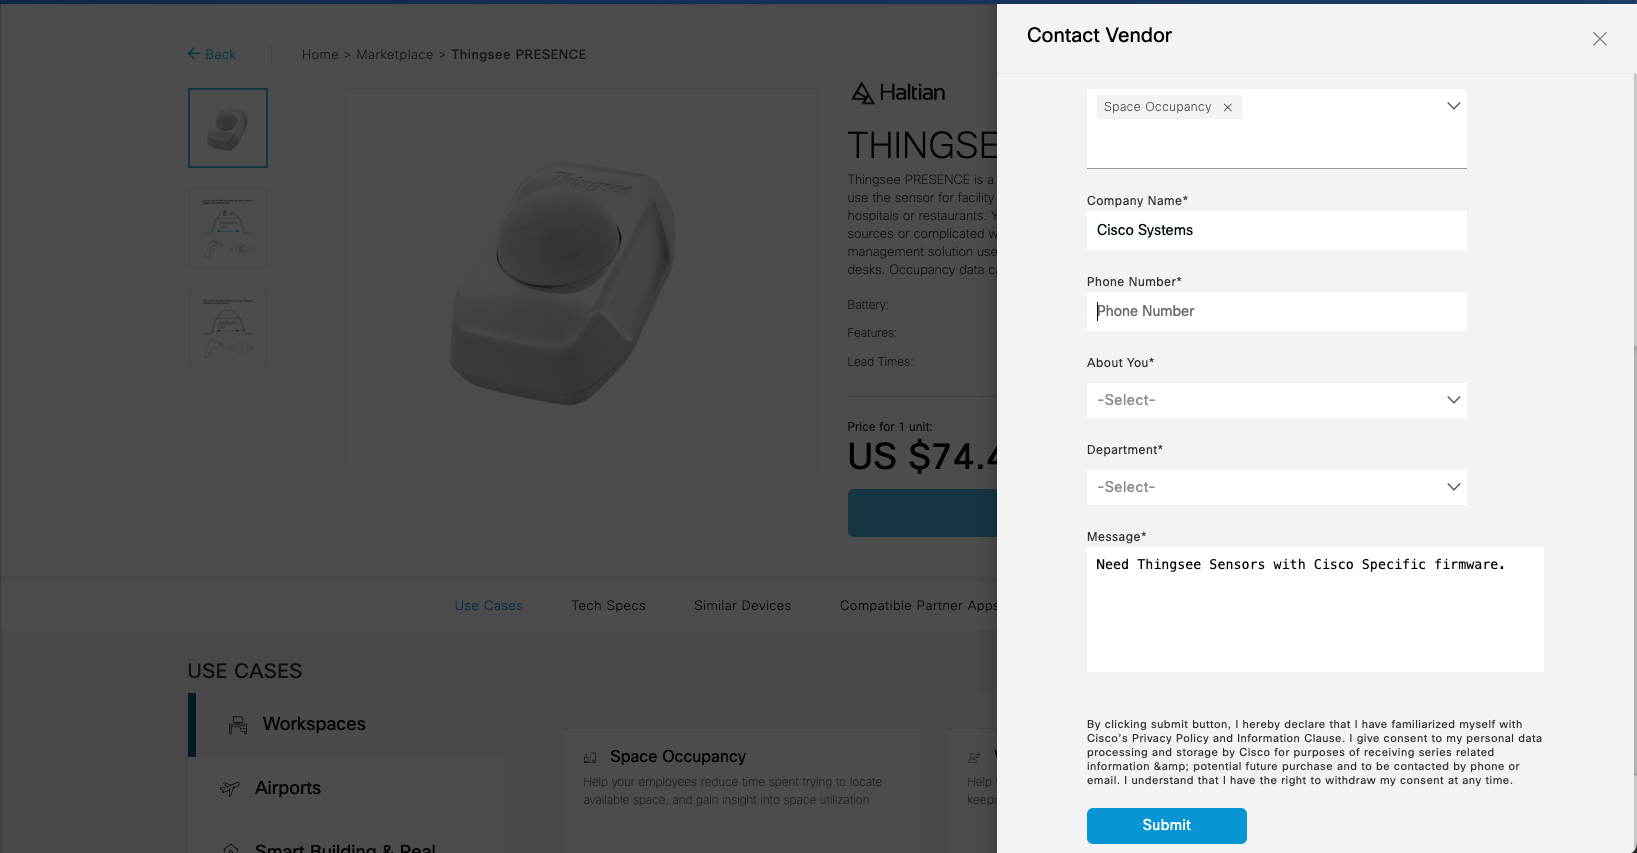
You will be seen this pop up window once you submit the form at the end.
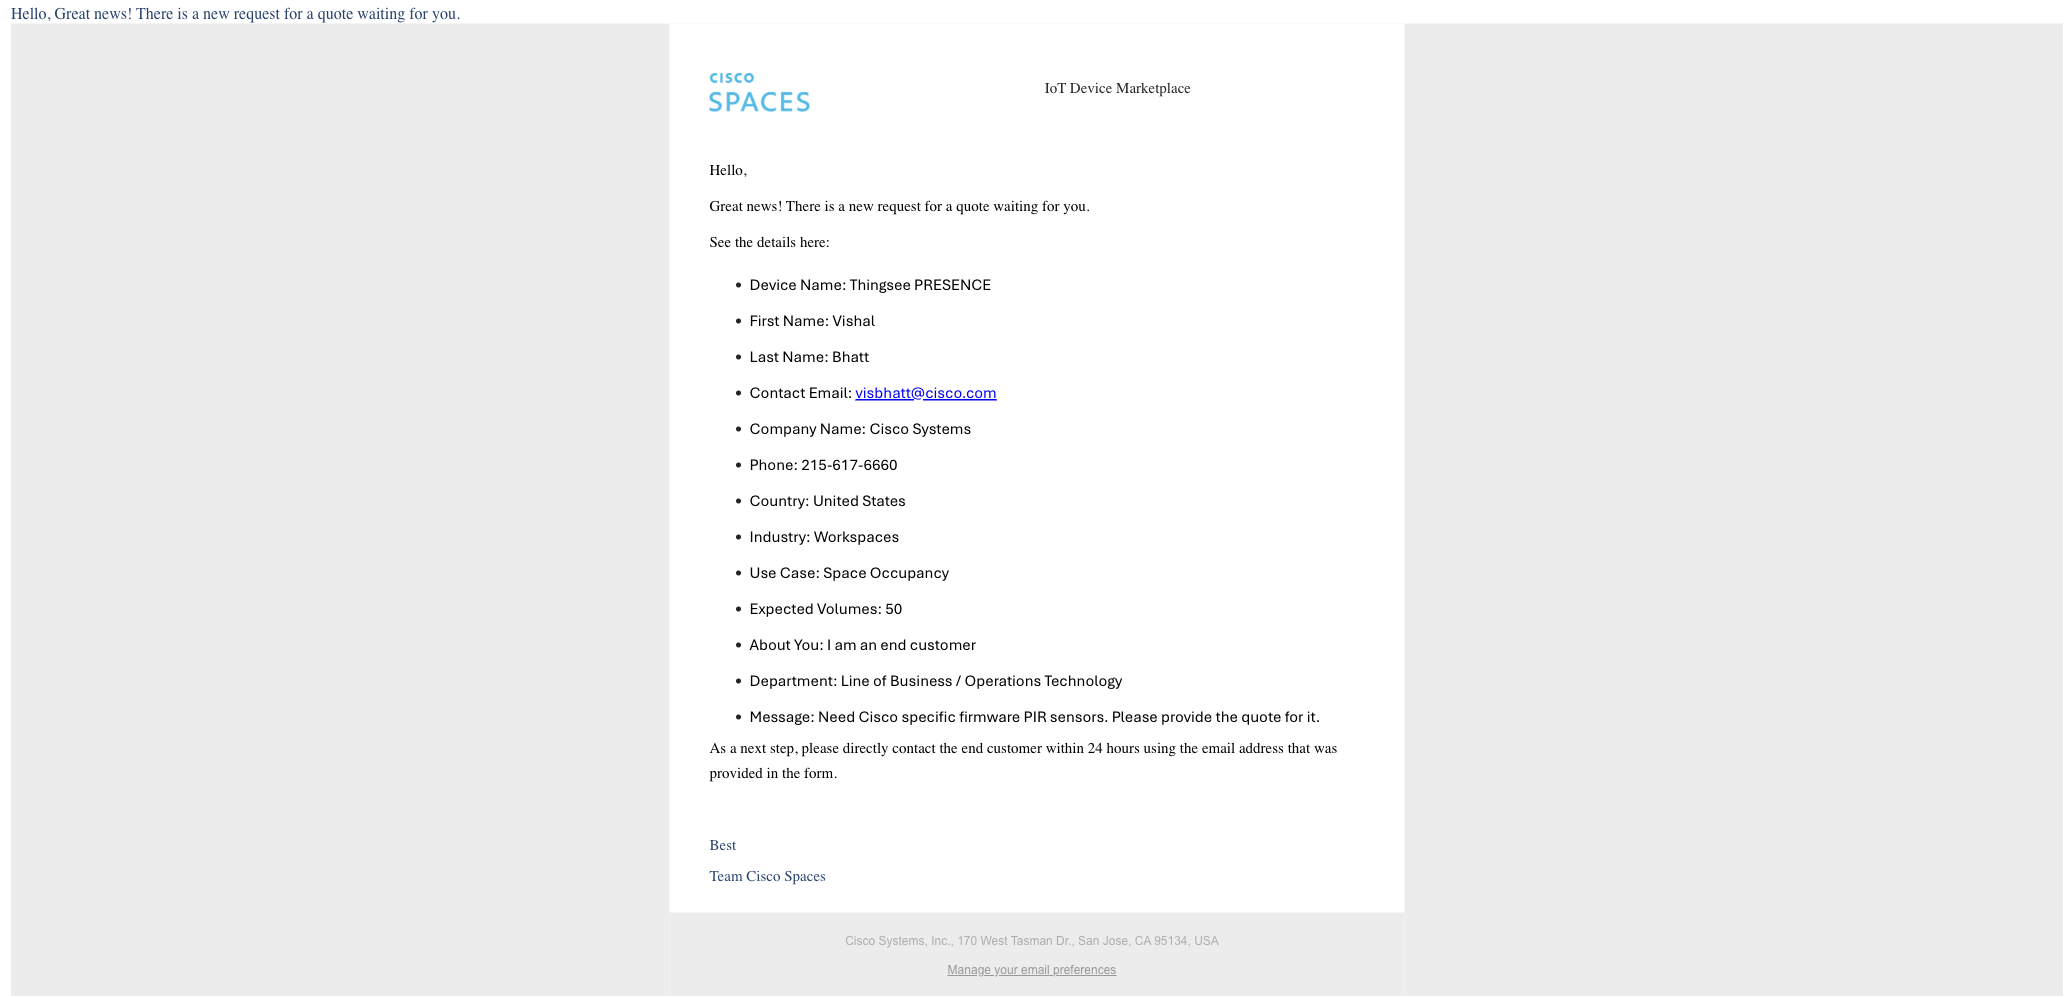
Haltian team should contact you further to create a Purchase order and ship the devices. Please keep an eye on emails from Haltian.
Make sure to include the Thingsee OCCUPANCY DOME in the purchase order for Desk occupancy use case. (Cost for the Thingsee OCCUPANCY DOME is extra and not included in the sensor price)
You will receive an invoice from the Haltian Team
The order ID would be given for those devices to be claimed under the IOT services.
Example : HLTN-H****
Supported and Unsupported Functionality
Supported Functionality
In the currently available Cisco Spaces + PIR architecture, the following functionality and outcomes are supported:
For Room Occupancy Data:
App or Feature | Frequency of Data | Outcome |
|---|---|---|
Kiosk | Real time | Binary room occupancy |
Space Manager App Room occupancy view | Real time | Binary room occupancy (i.e., occupied or unoccupied) |
Space Manager App Room occupancy report | Historical | Binary room occupancy as an exportable report |
Supported Verticals: Workspaces.
While other verticals may have similar use case and room types etc. where the solution may work just as well, Cisco has validated this solution only in workspaces verticals and is the only vertical type supported for now.
Supported Space Types: Small Meeting Rooms (Max. Occupancy of Room 3), Desks and Individual Meeting Pods
Unsupported Functionality:
The following functionalities and outcomes are currently not supported by the Cisco Spaces + PIR solution. While there is potential for these features to be introduced in the future, there is no official confirmation or guarantee at this time, and they are currently unavailable to customers.
If needed, please work directly with Cisco Spaces product team to discuss further.
For Room Occupancy Data:
App or Feature | Frequency of Data | Outcome |
Space Utilization App | Historical | Room Occupancy in the dashboard (i.e., occupied or unoccupied) |
Meta API (Firehose API) | Real time | Room occupancy |
Smart Rooms | Real time | HVAC control based on occupancy |
Smart Desks | Real time | Desk Occupancy and monitoring |
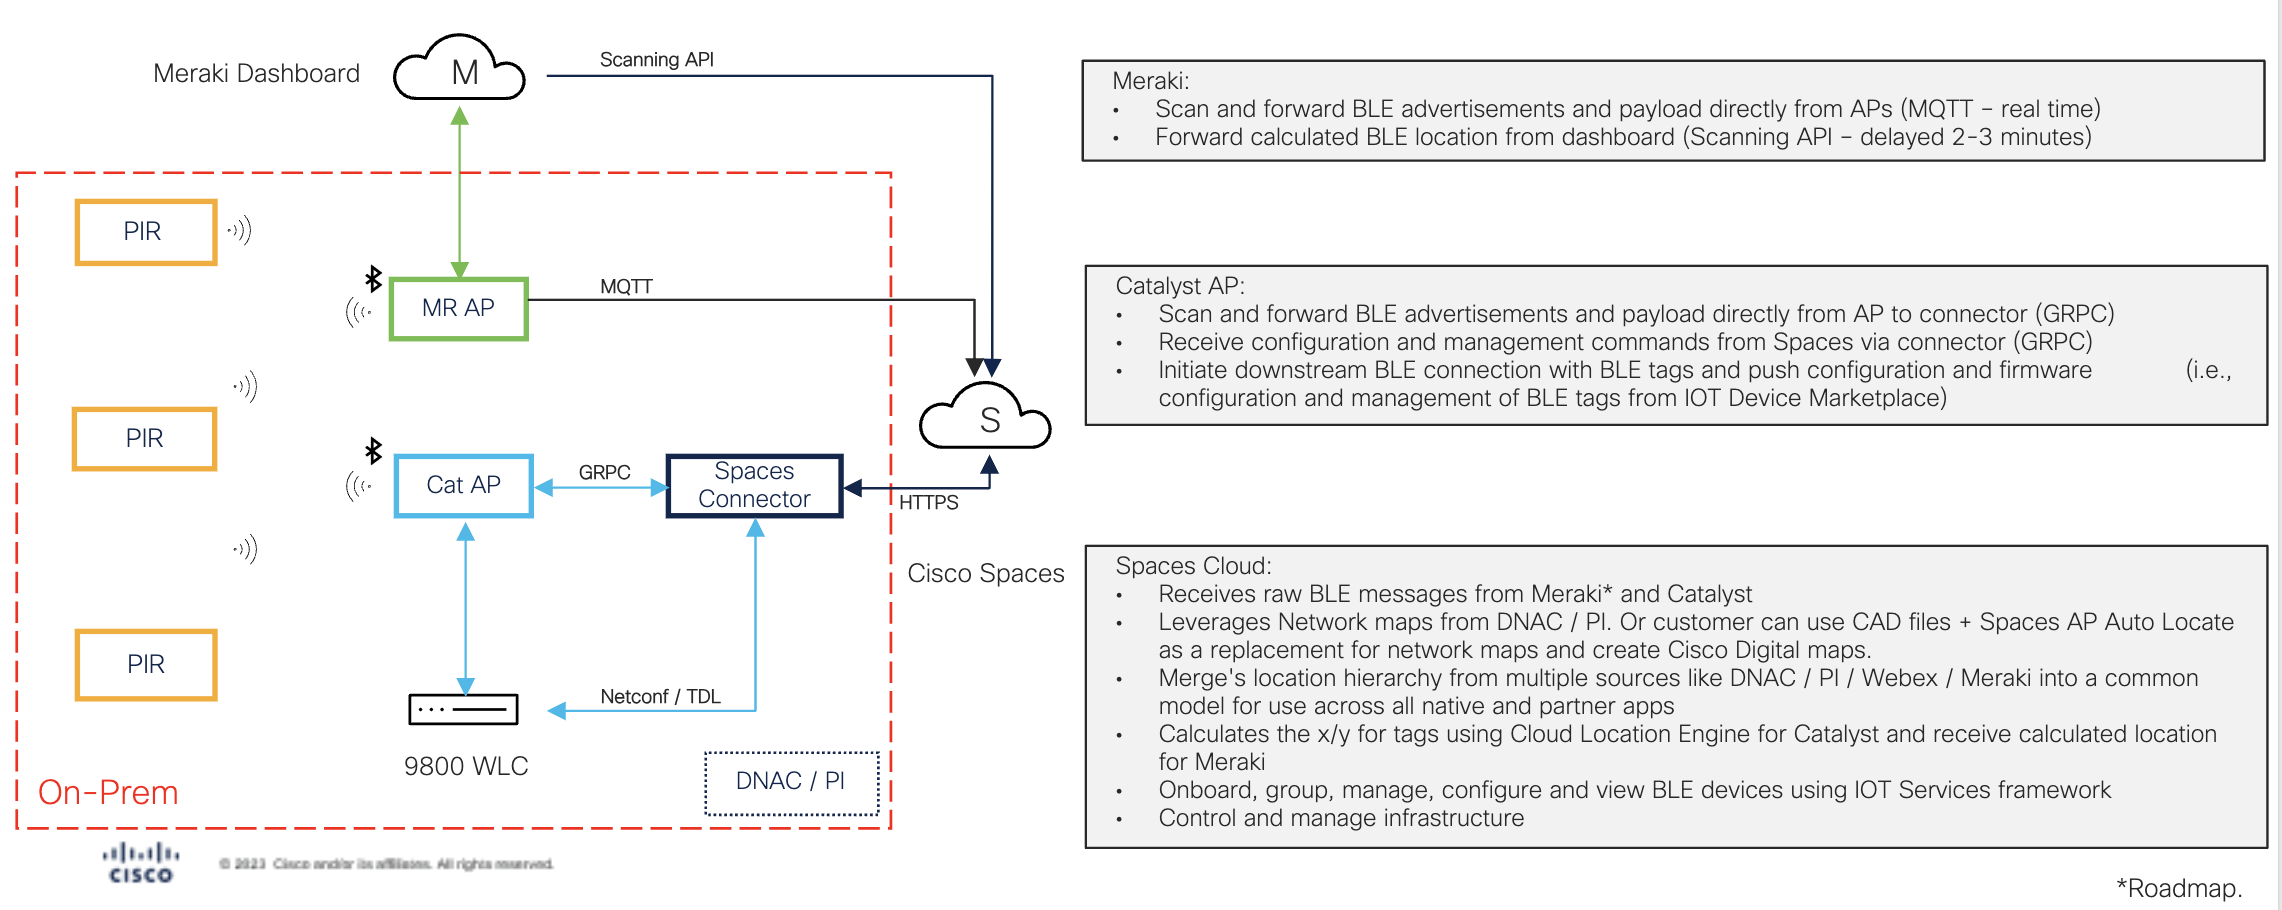
Reference Architecture
Deployment Workflow (PIR sensor setup and activation)
Claiming PIR sensor using Order ID
Login into Cisco Spaces Dashboard
Navigate to IOT Services and Device Management
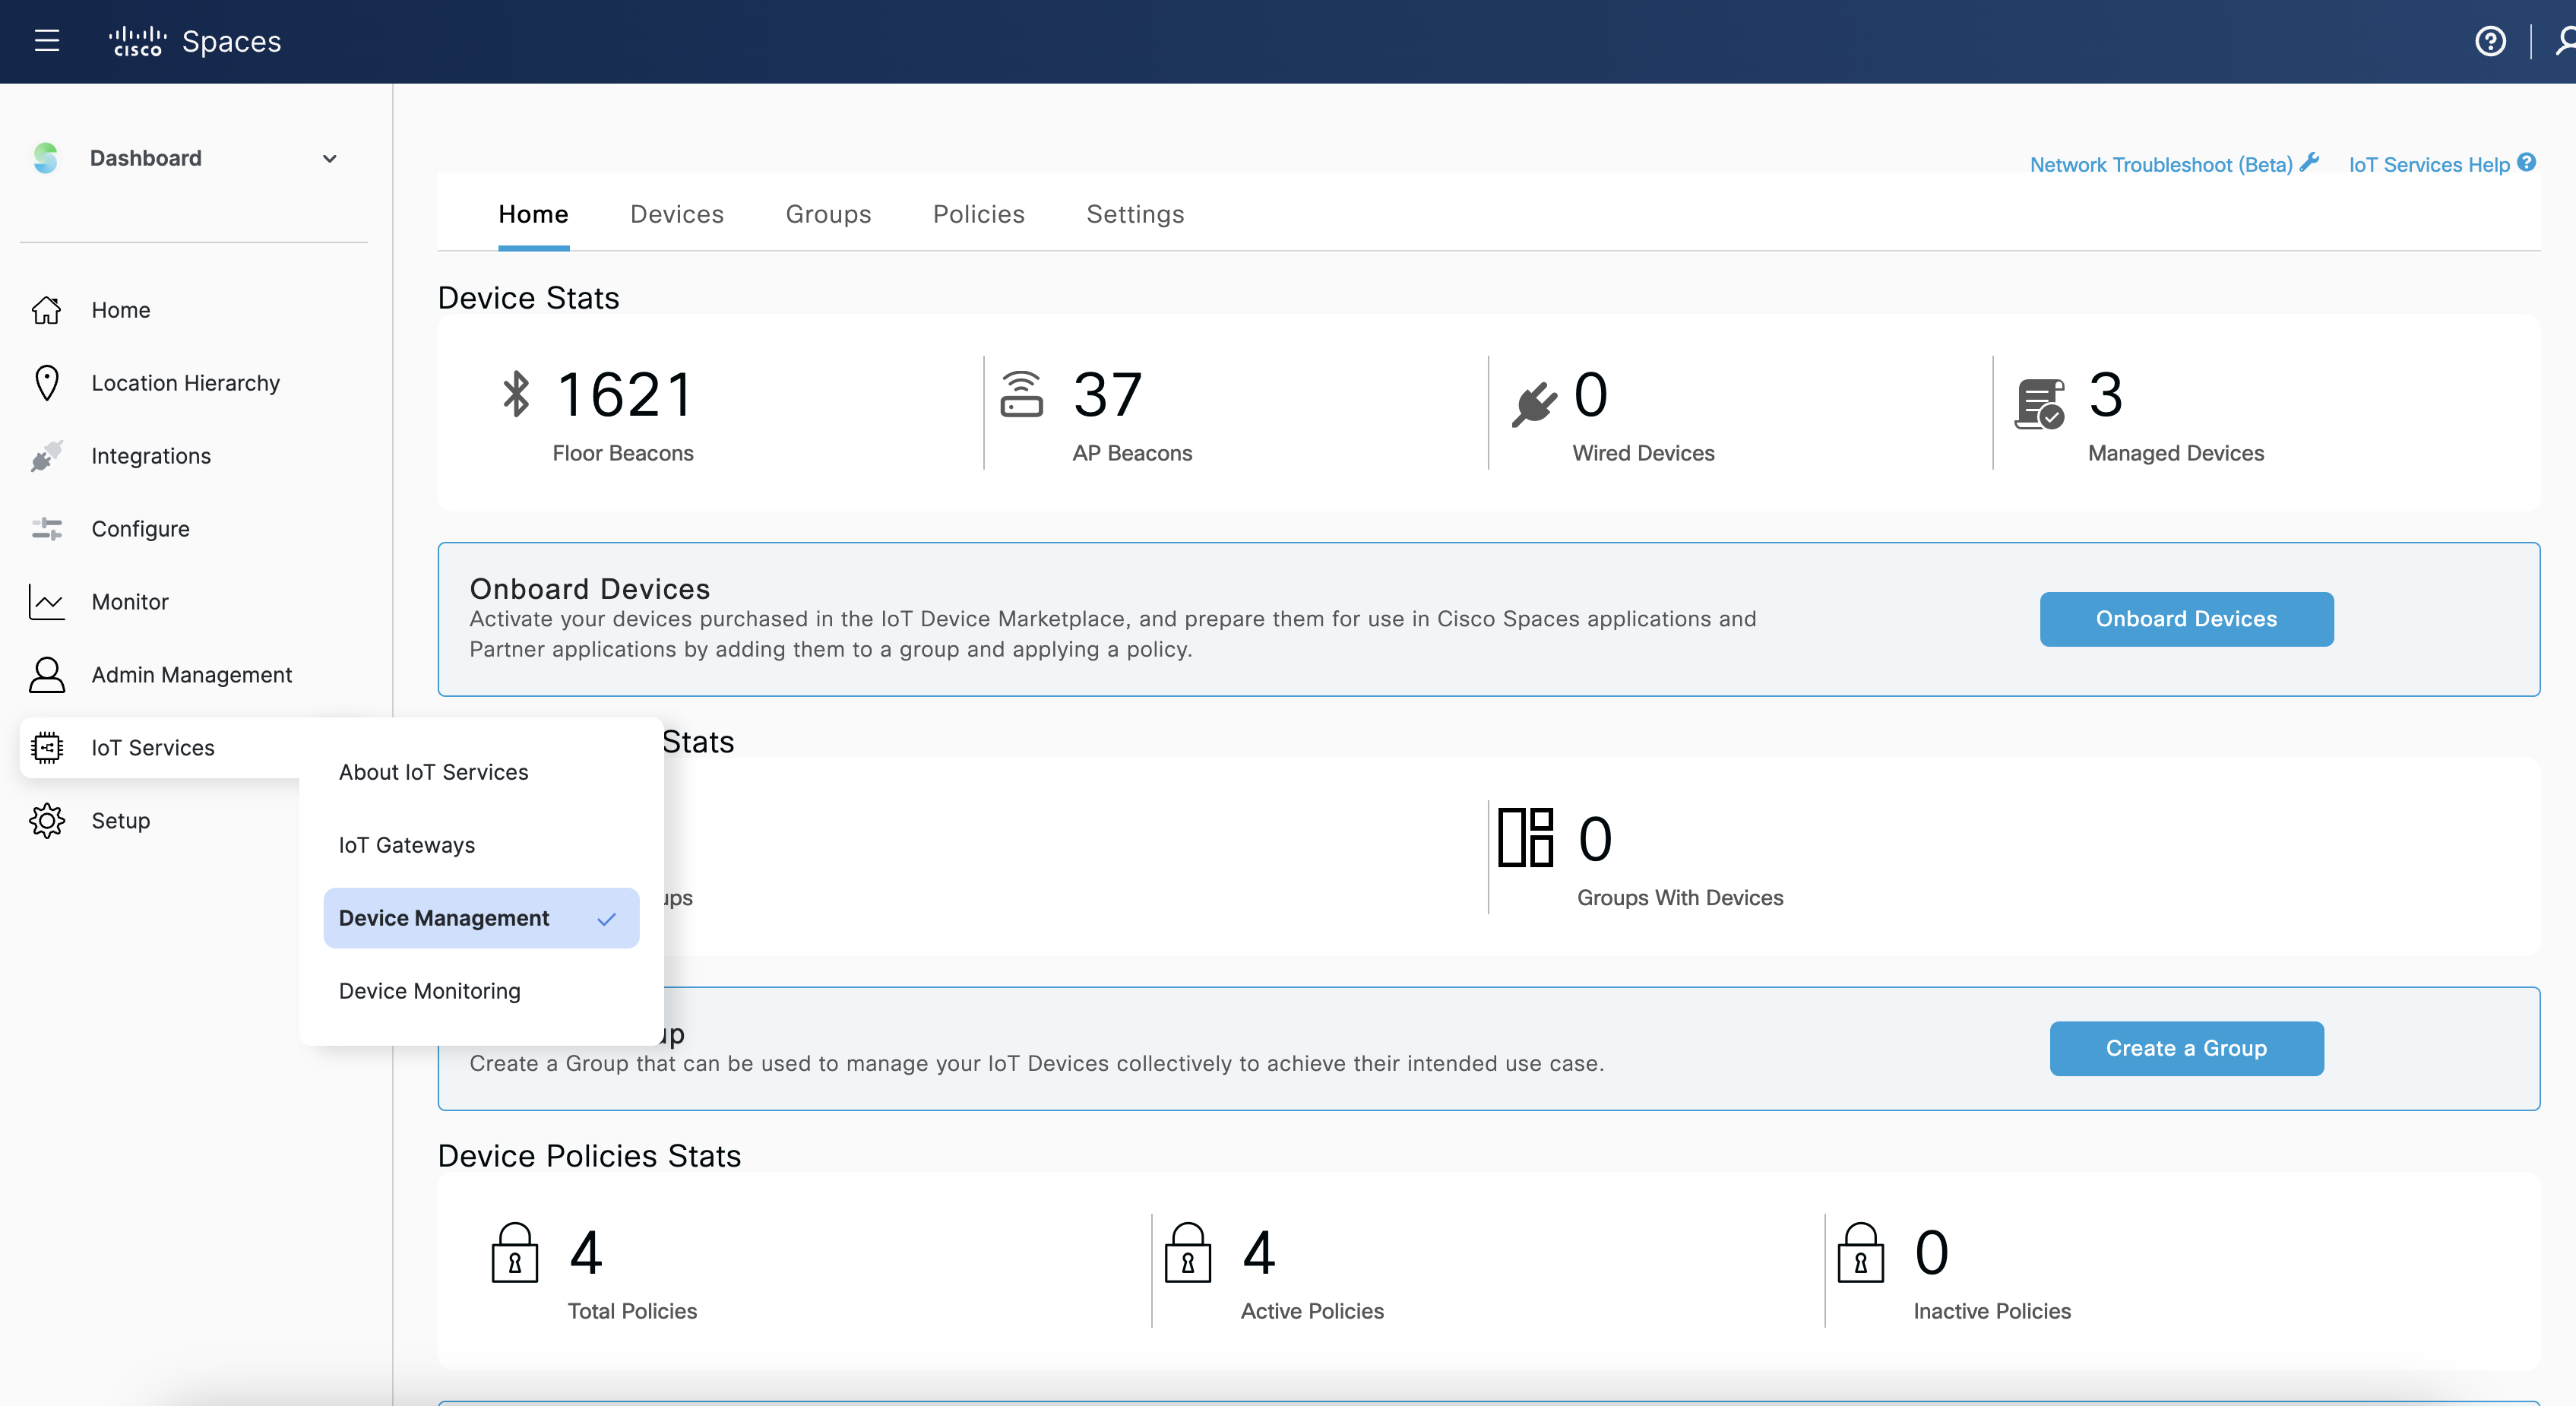
Click on Onboard Devices and select Floor Beacons and click next
Use the Order ID provided by vendor and click Add to inventory
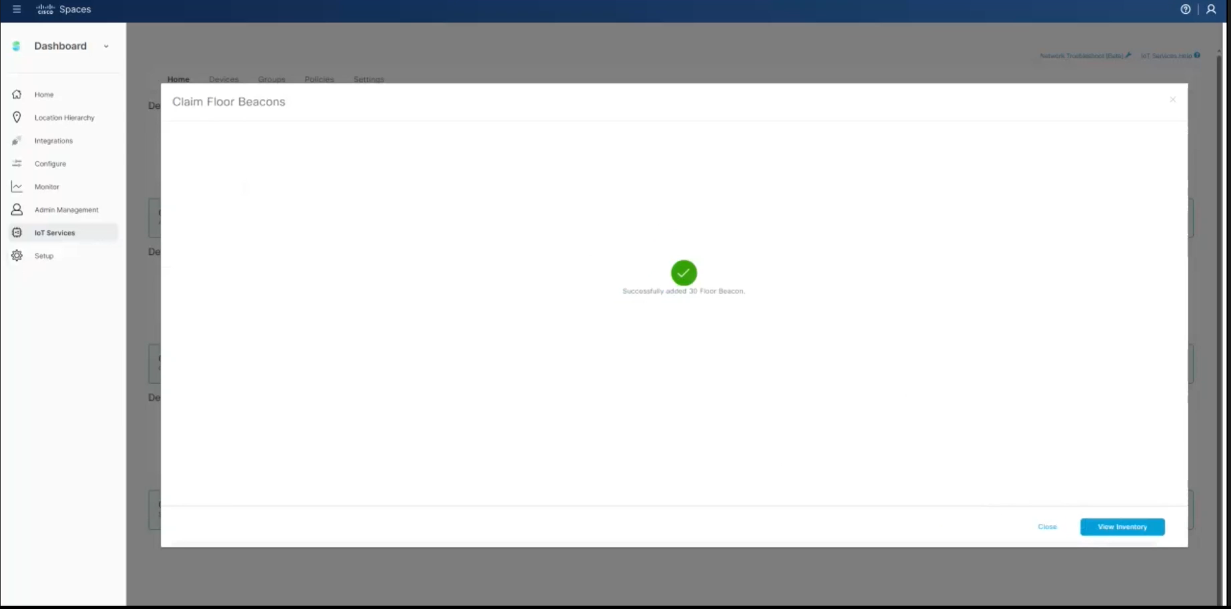
It will show Claimed successfully claimed and can view those devices by clicking view inventory under claimed devices.
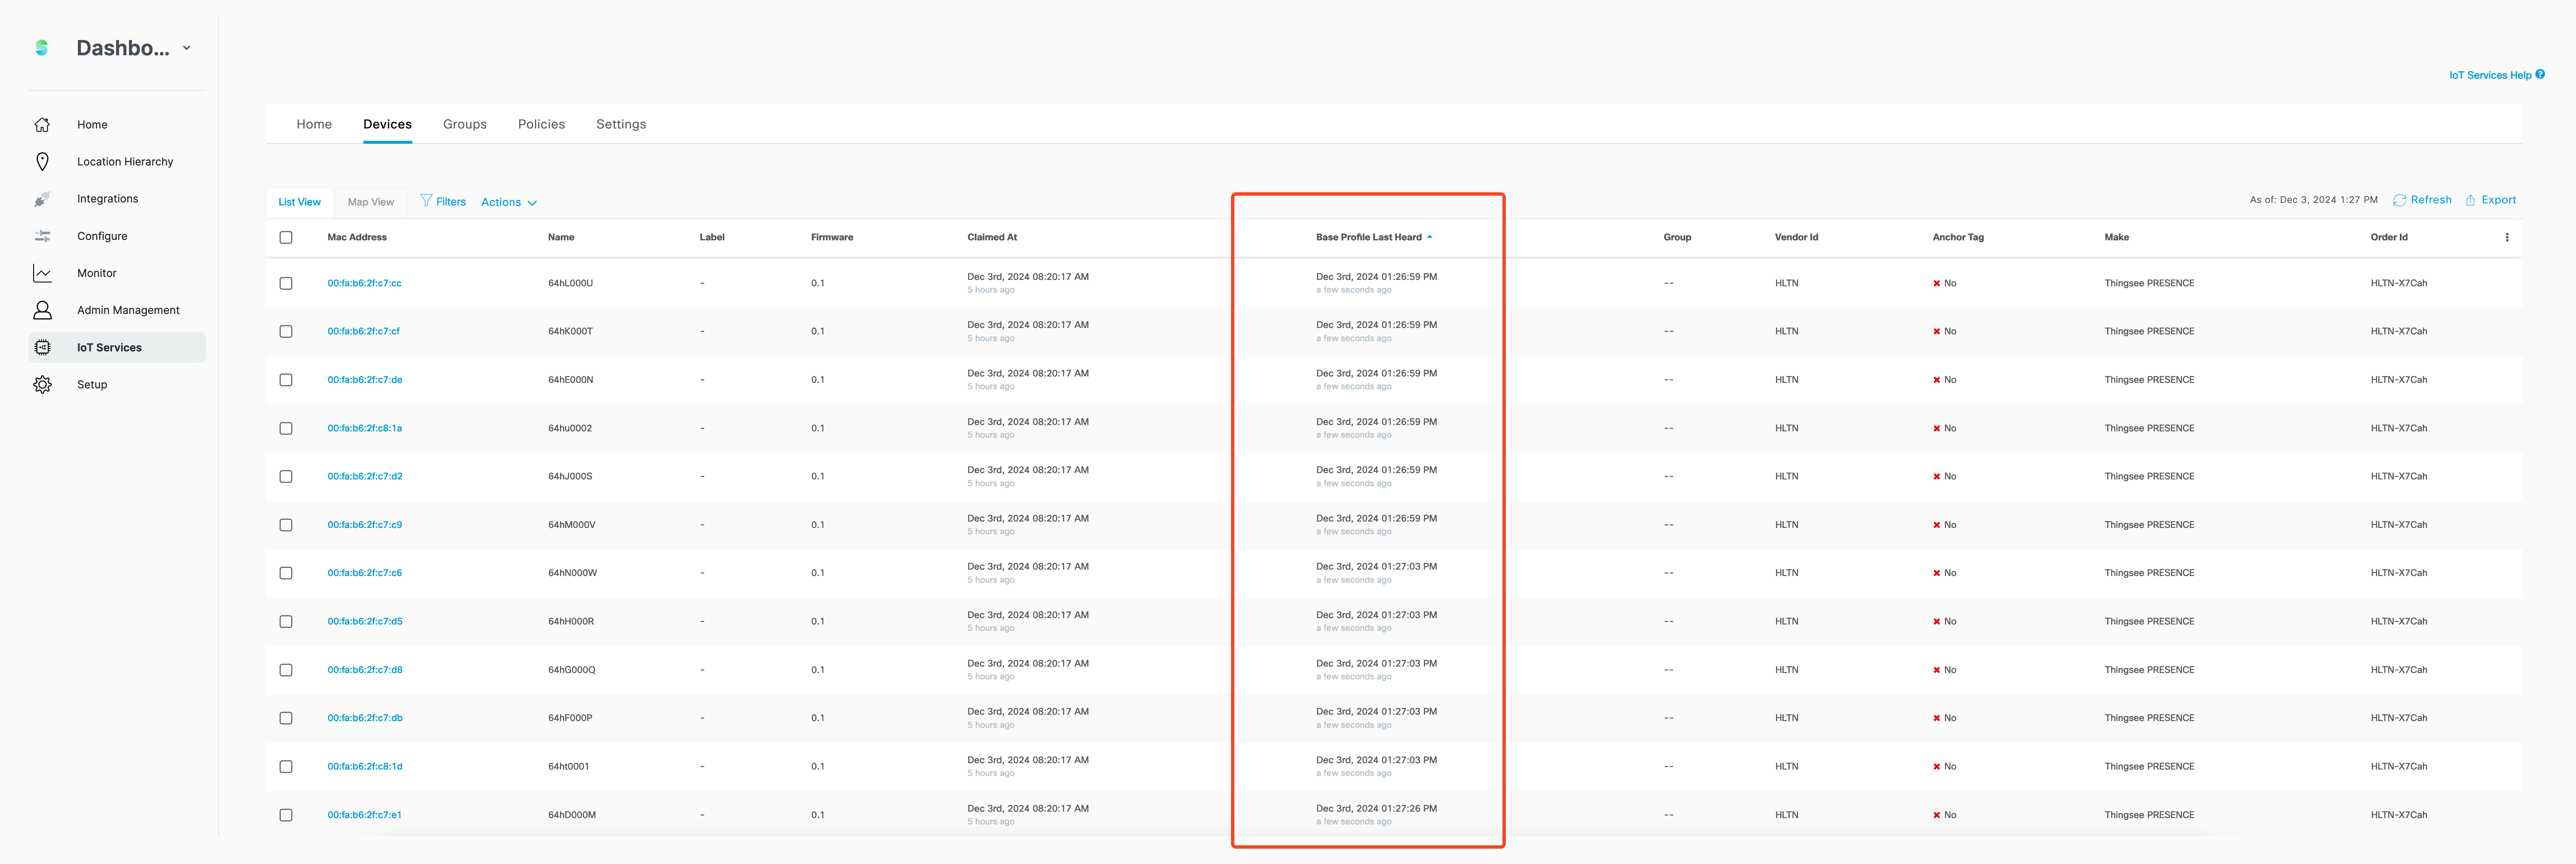
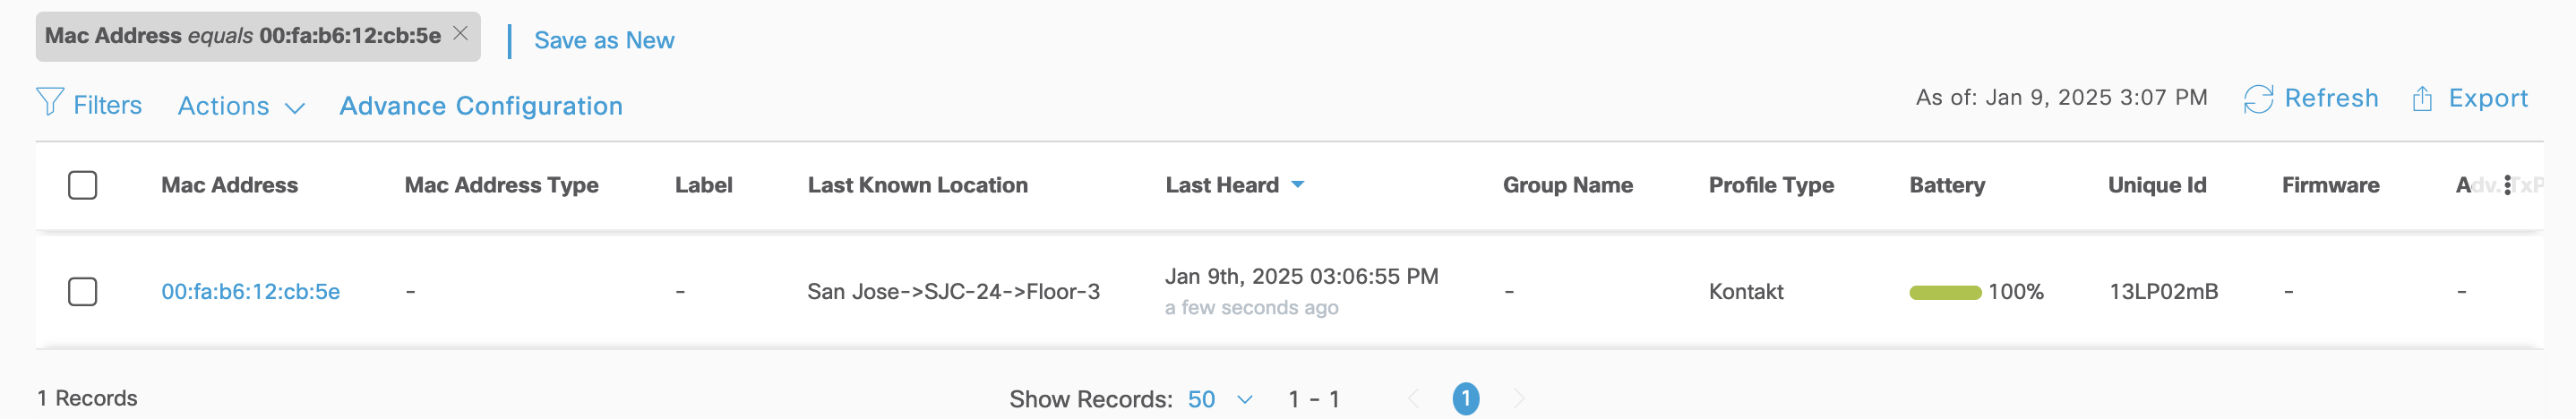
Make sure the all the Sensors are showing under the Claimed Sensors under IOT Services > Device management > Devices > Claimed Sensors
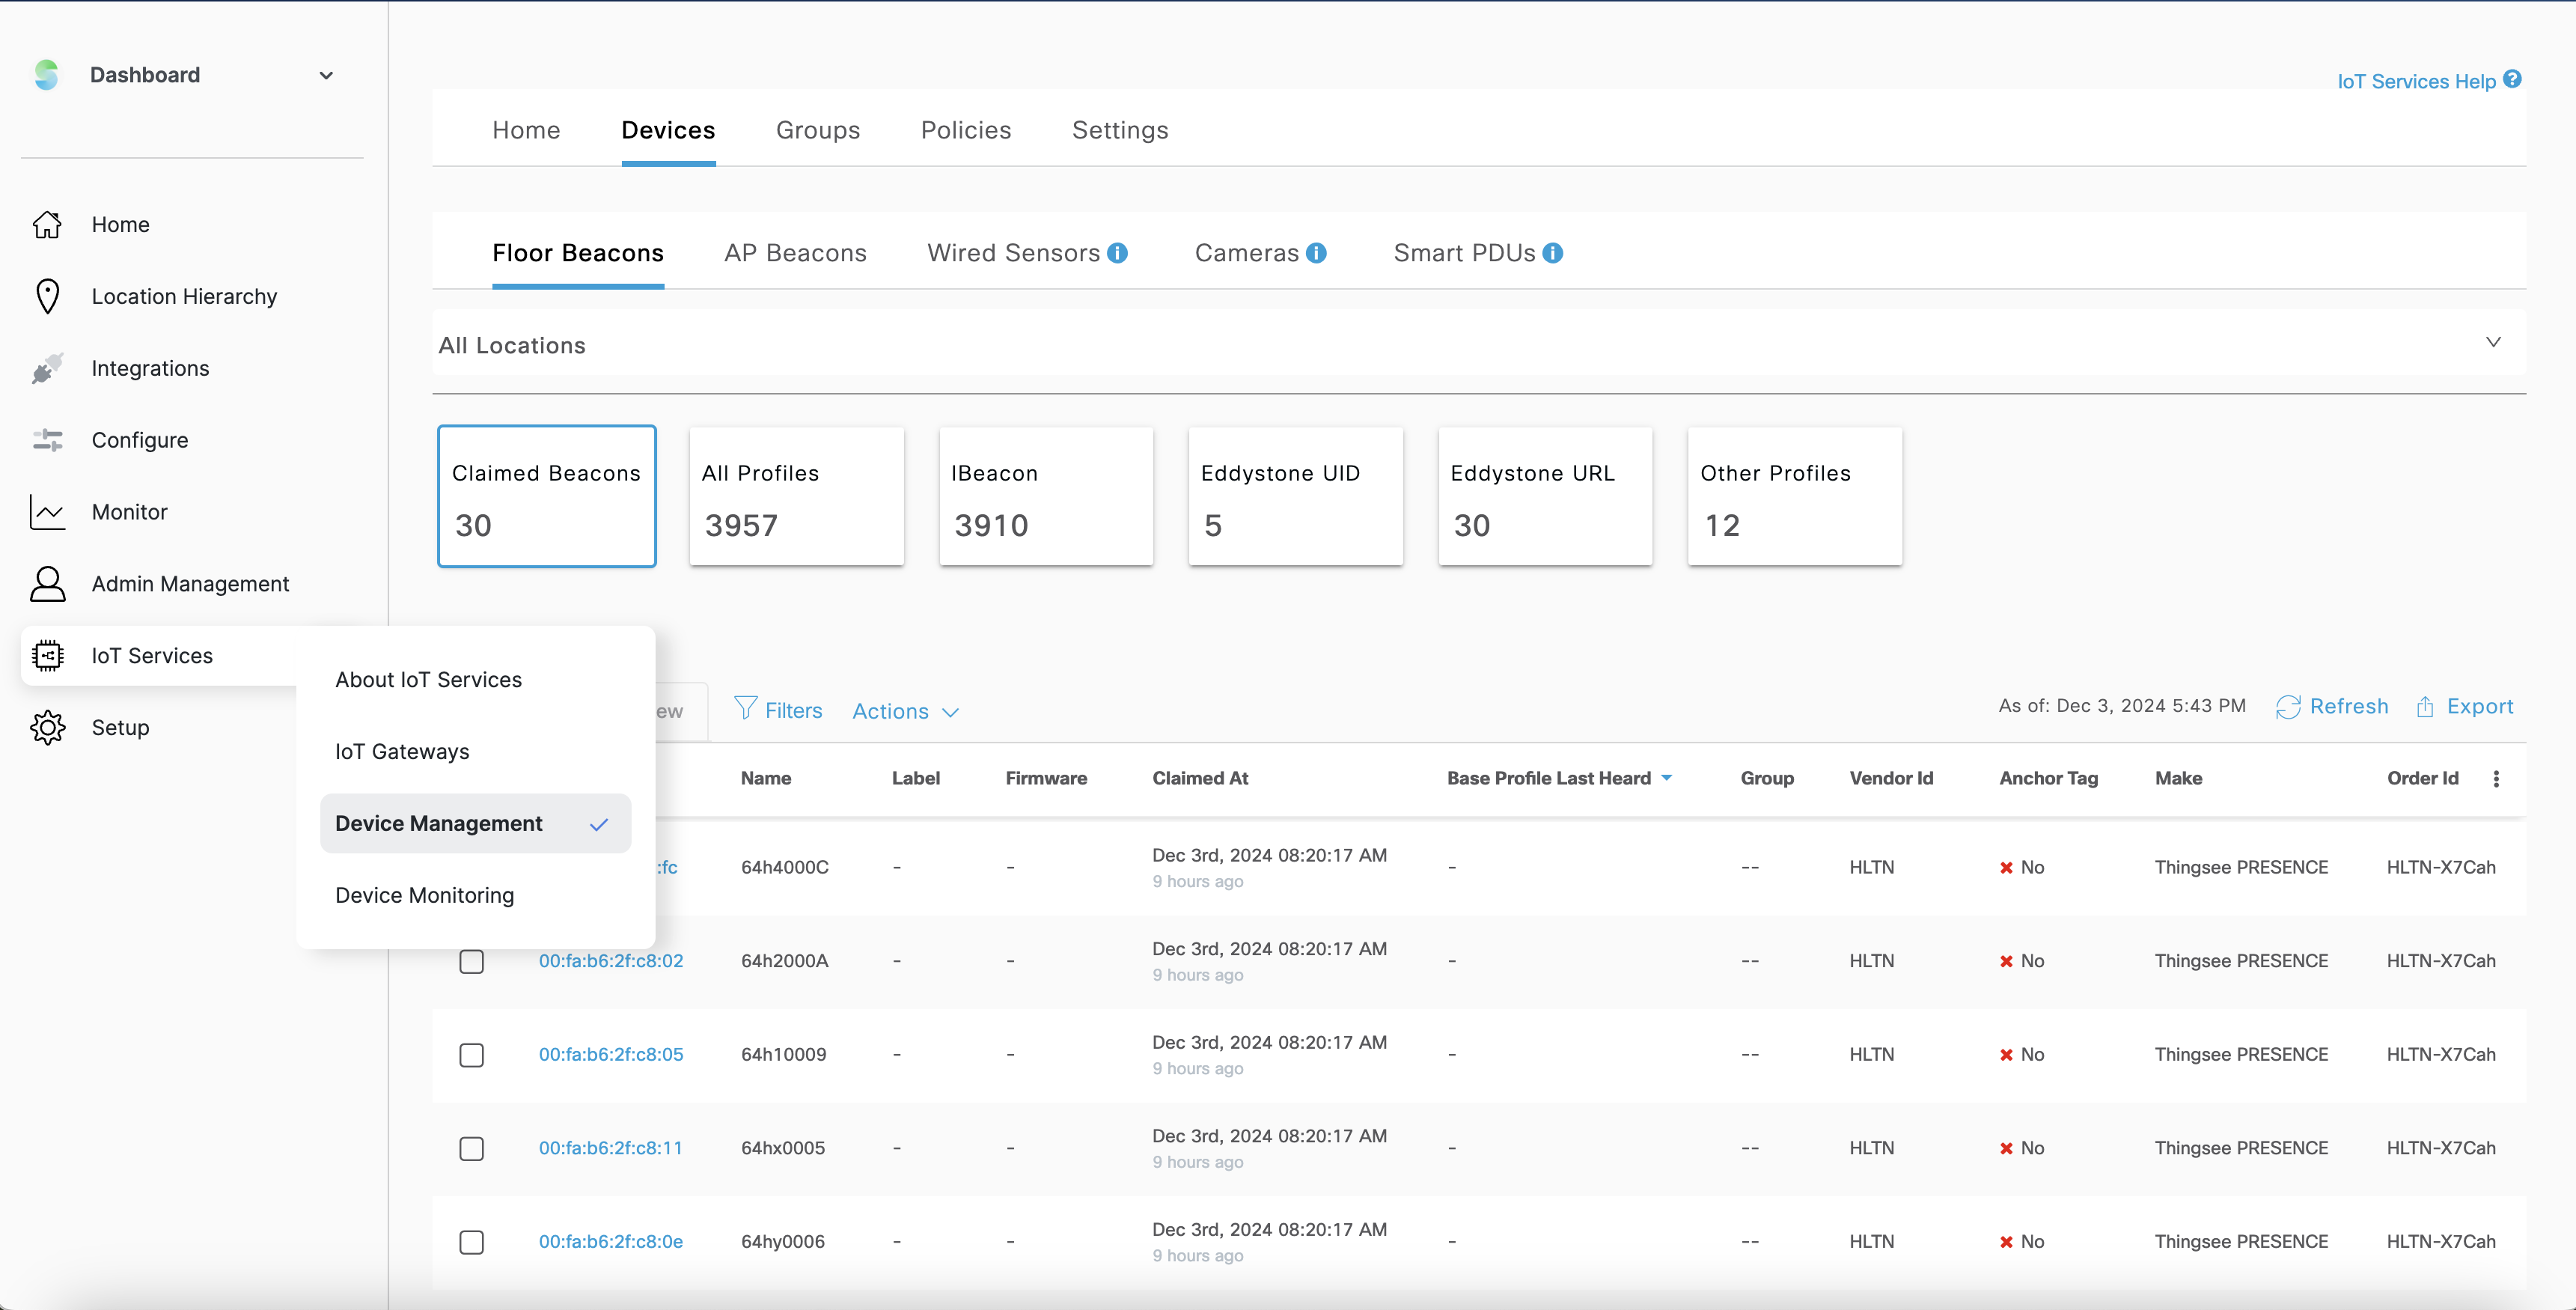
Once Sensors are been claimed, make sure to verify Base Profile last heard under the IOT services > Device Management > Claimed Beacons > Base Profile last heard is updated (usually shows few seconds ago for active beacons)
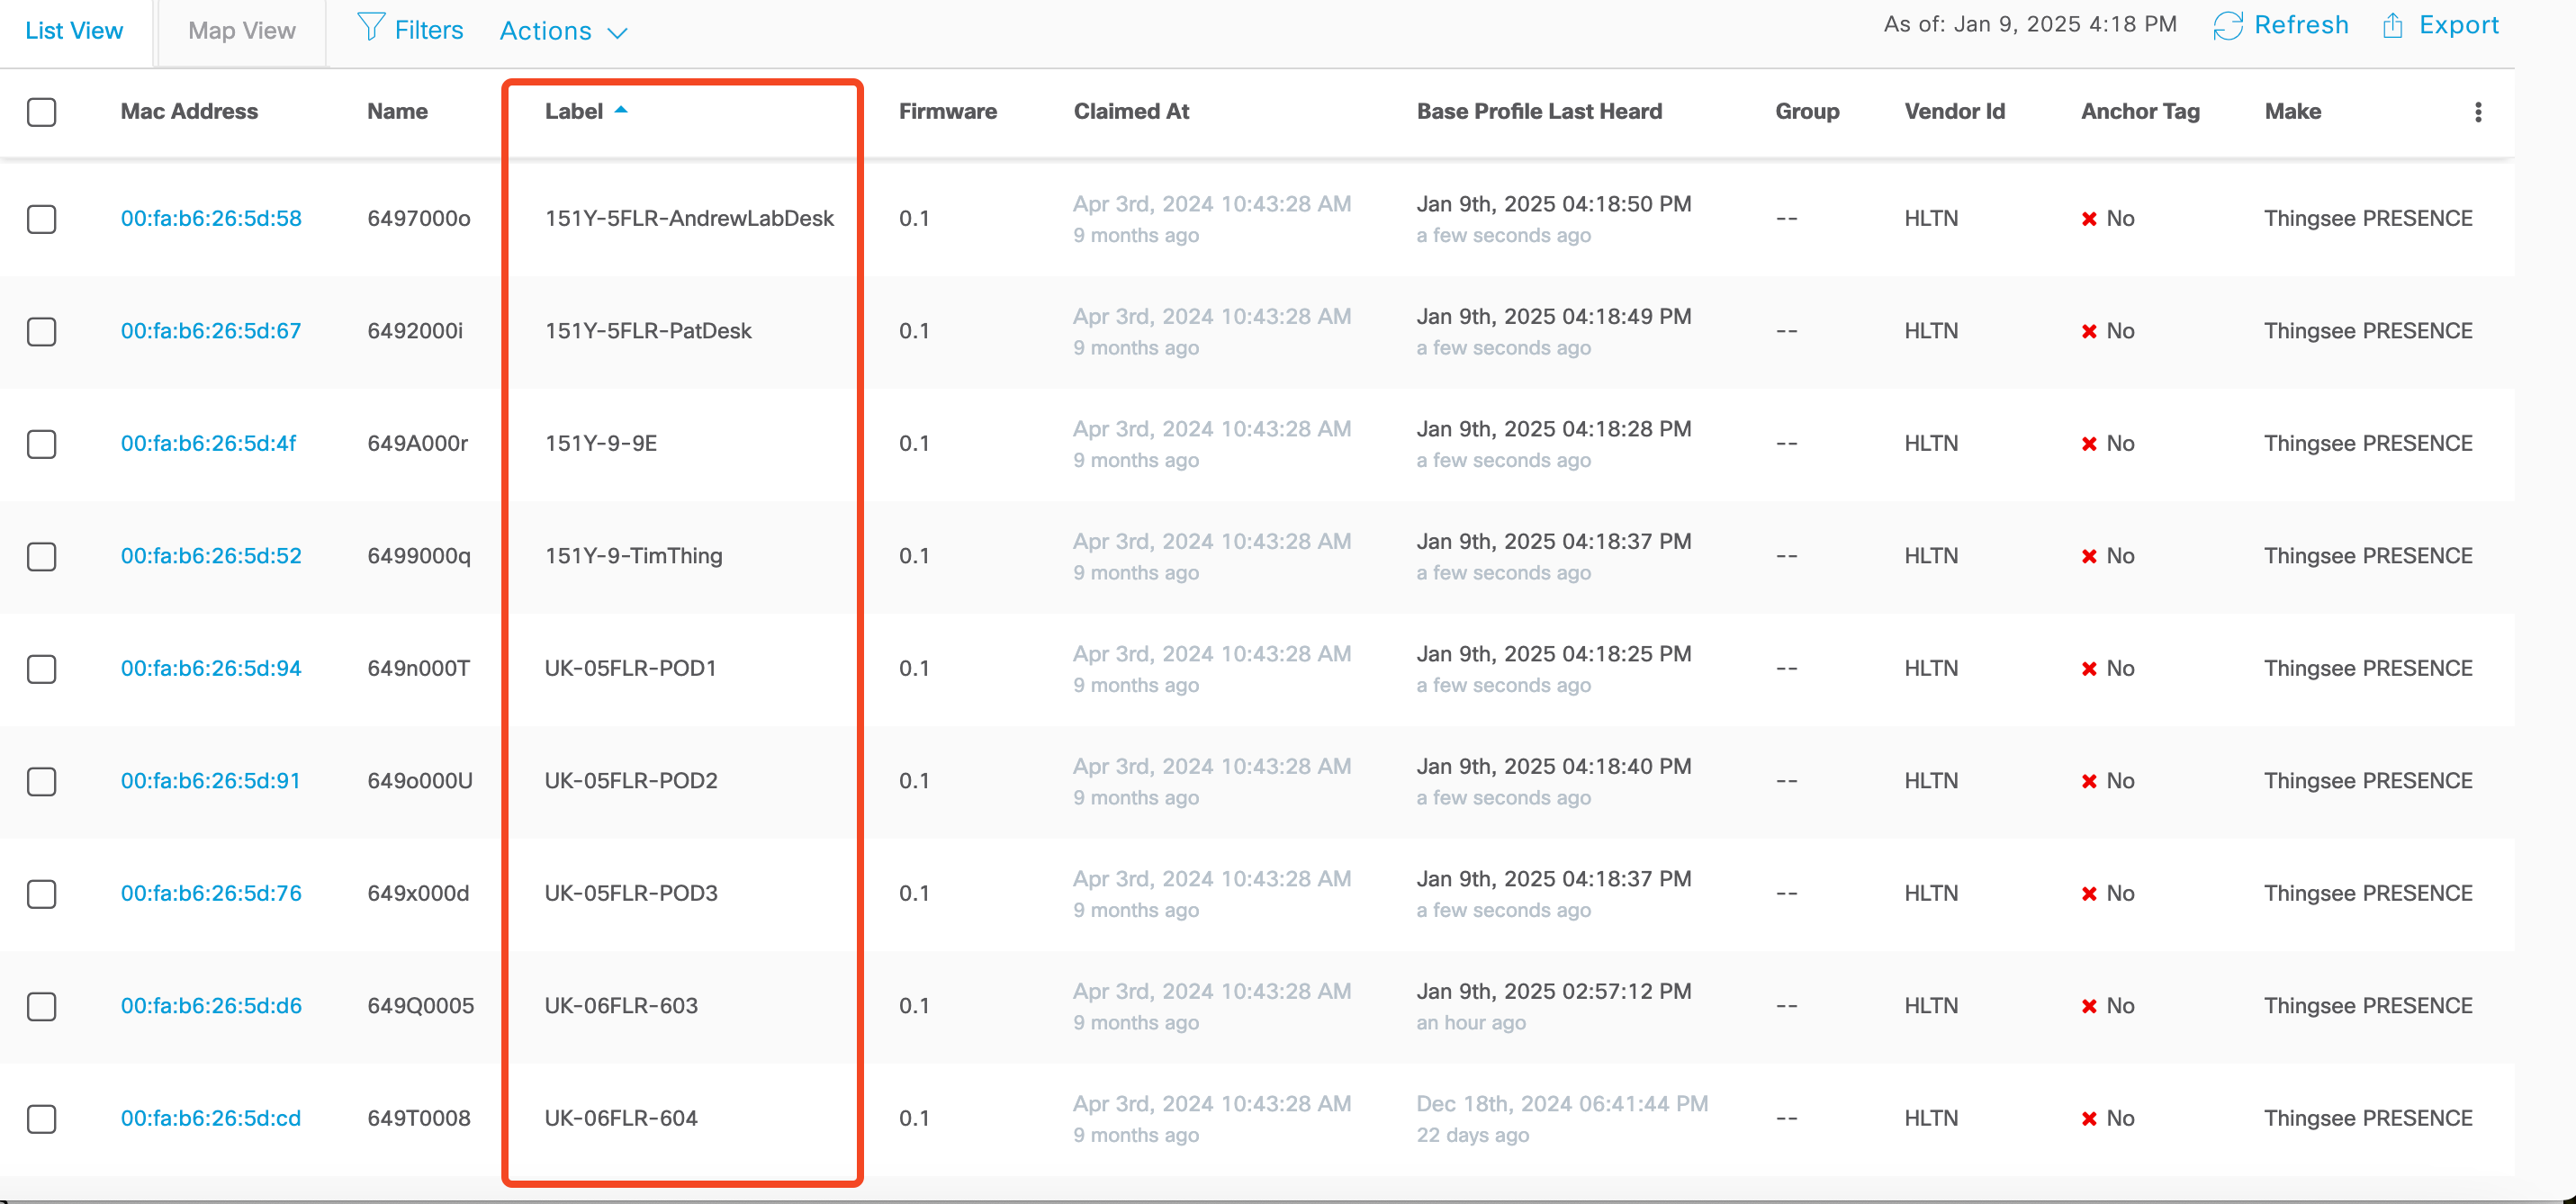
Best Practices : Label the PIR sensors in order to manage or track them easily as shown below as soon as you claim the devices.
Placement of the PIR sensor
PIR Sensors are only recommended for Small meeting pods, Desk set up or small meeting rooms with capacity of 2-3 people.
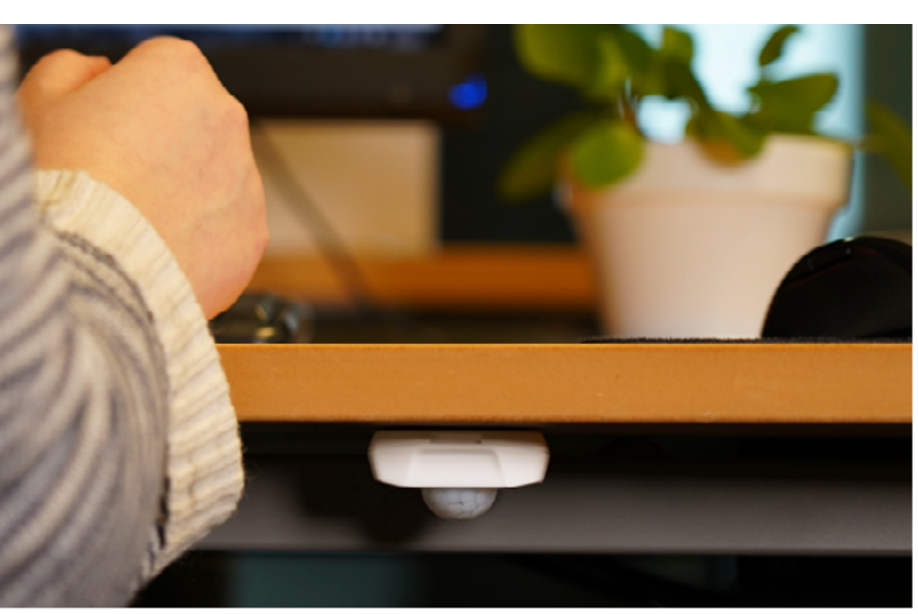
Workplace occupancy detection
Thingsee PRESENCE can be installed under a table to detect the usage of a working space. Sensor sensitivity should be decreased to avoid unwanted detections outside the working space.
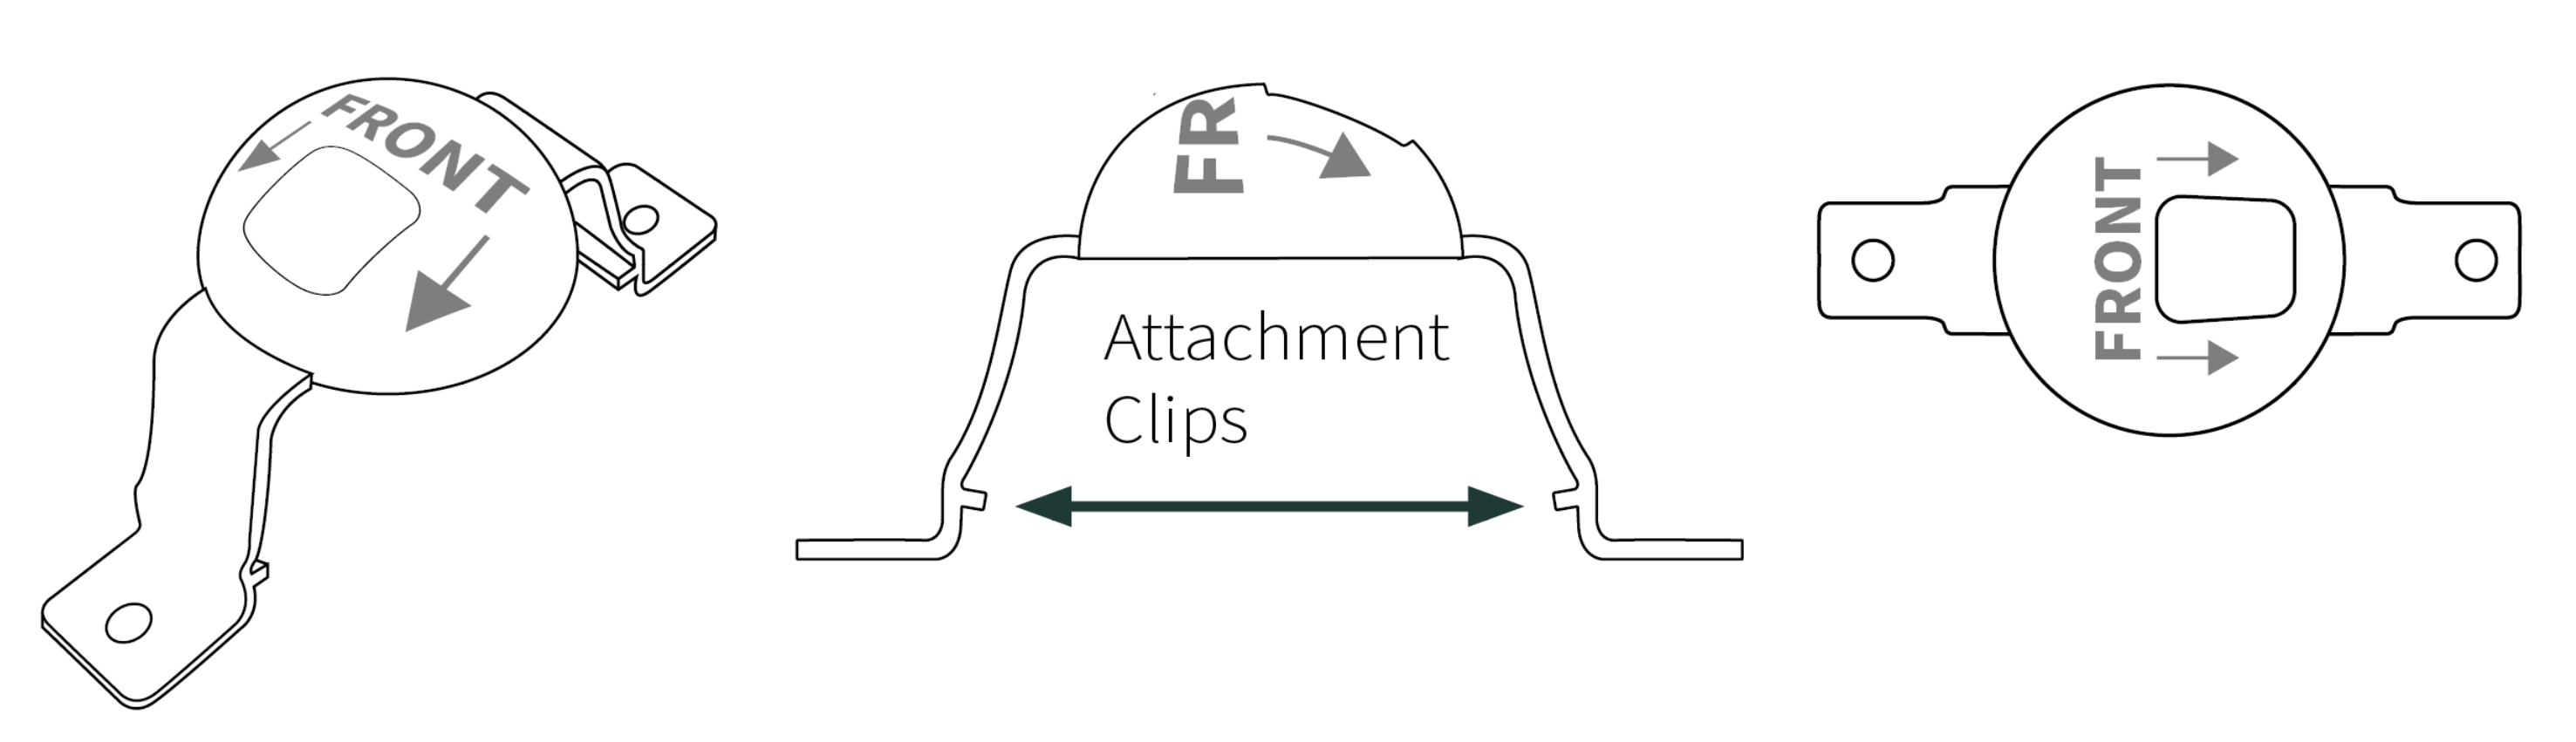
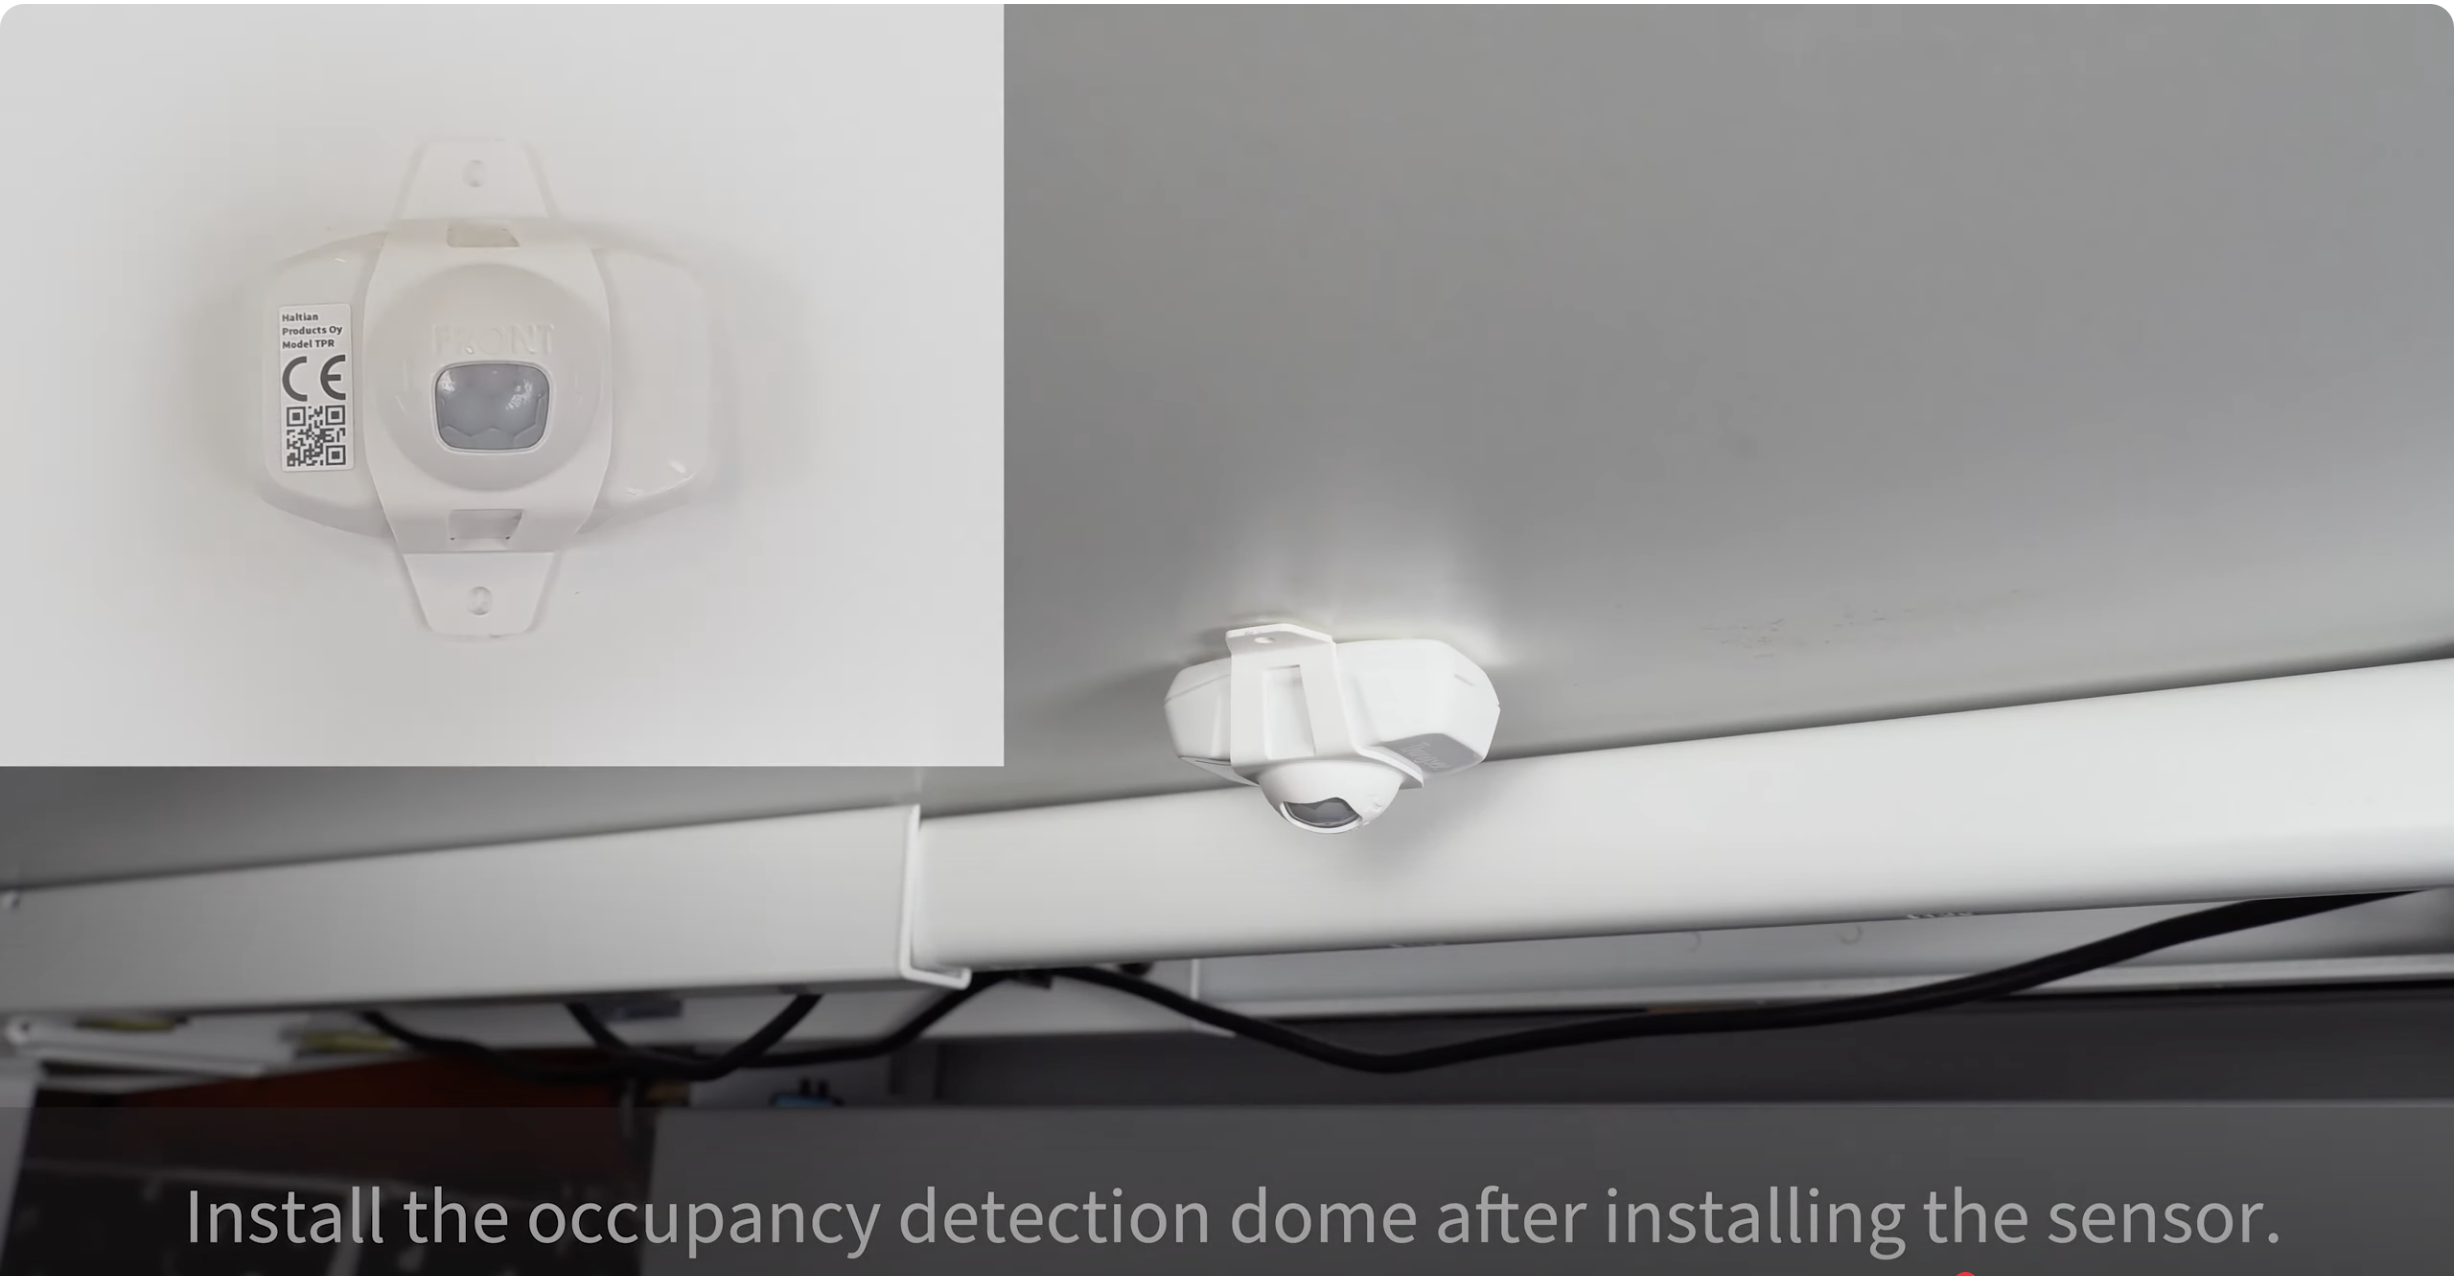
Using Workplace Occupancy Dome
The detection beam can easily be adjusted with a separate, easy to install, Workplace Occupancy Dome. The detection beam is more accurate when the hole on top of the sensor is facing front.
Installing the sensor under in a small meeting room or pods
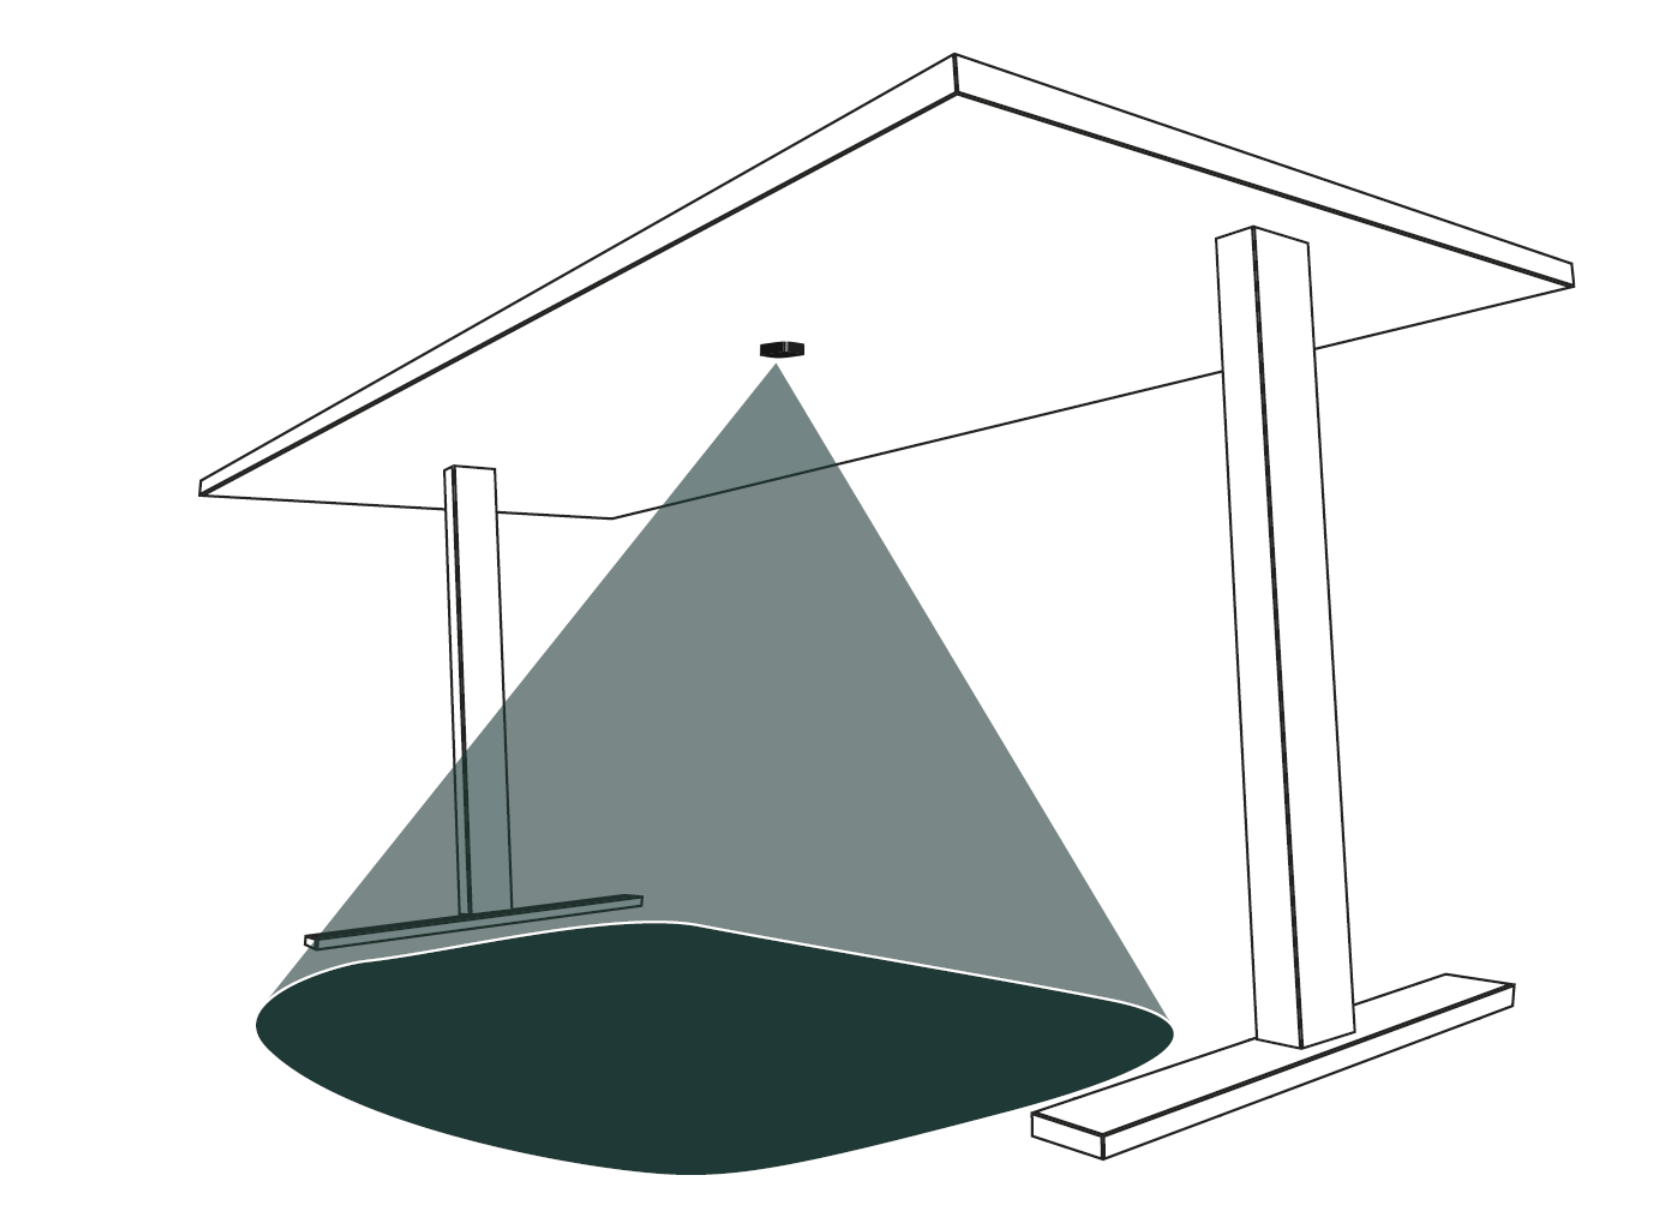
Install Thingsee PRESENCE at a location from where the it could cover the maximum area to transmit the infrared signals. Best Practice is to place the sensor at the 2/3 height of the wall or side of a meeting room’s wall which could cover the maximum area to transmit the infrared signals.
Below are few examples of the Placing the PIR sensors but not limited to.
Meeting Pod
Small Meeting room
Small Meeting room
Installing the sensor under a table
Install Thingsee PRESENCE under the table as middle as possible. If there are any objects, such as table legs, under the table, place the sensor on the user side of the object. Make sure there is a 50 mm gap between Thingsee PRESENCE and the object so that it can be easily maintained.
Below are few examples of the Placing the PIR sensors but not limited to.

Haltian Guided installation of the Thingsee Presence Sensor
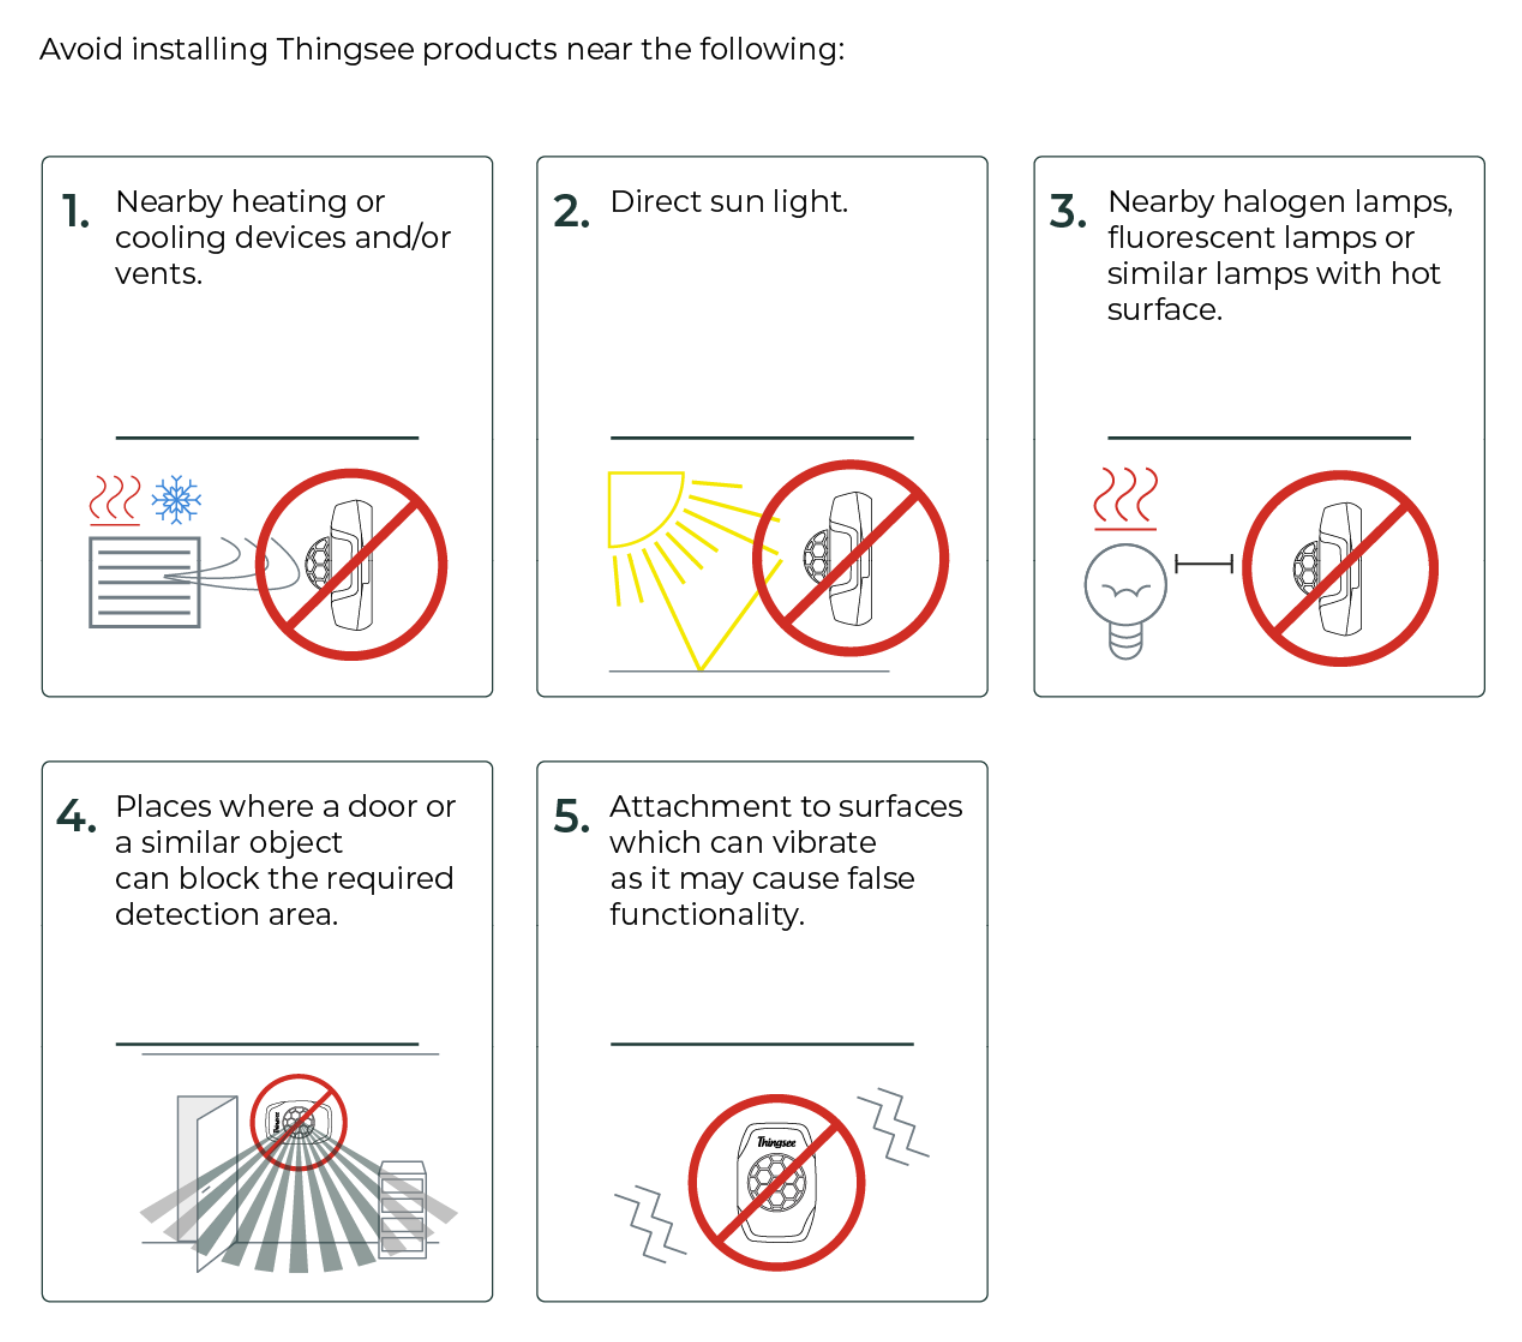
Things to avoid in installation (Best Practices)
https://youtu.be/35B_peJpTUsChanging the batteries
If you change the batteries, Haltian recommends using Varta Industrial Pro 1.5 V AAA LR06 alkaline batteries.
Open the sensor to change the batteries or reboot the device by replacing the batteries.
Integrating Space manager
Once the Sensor is been claimed, can be associated under Space manager for a Room occupancy use case.
Make sure the Digital space where you are associating the PIR Sensor is a “Meeting room “ as shown below under the Digital Map and publish the map again.
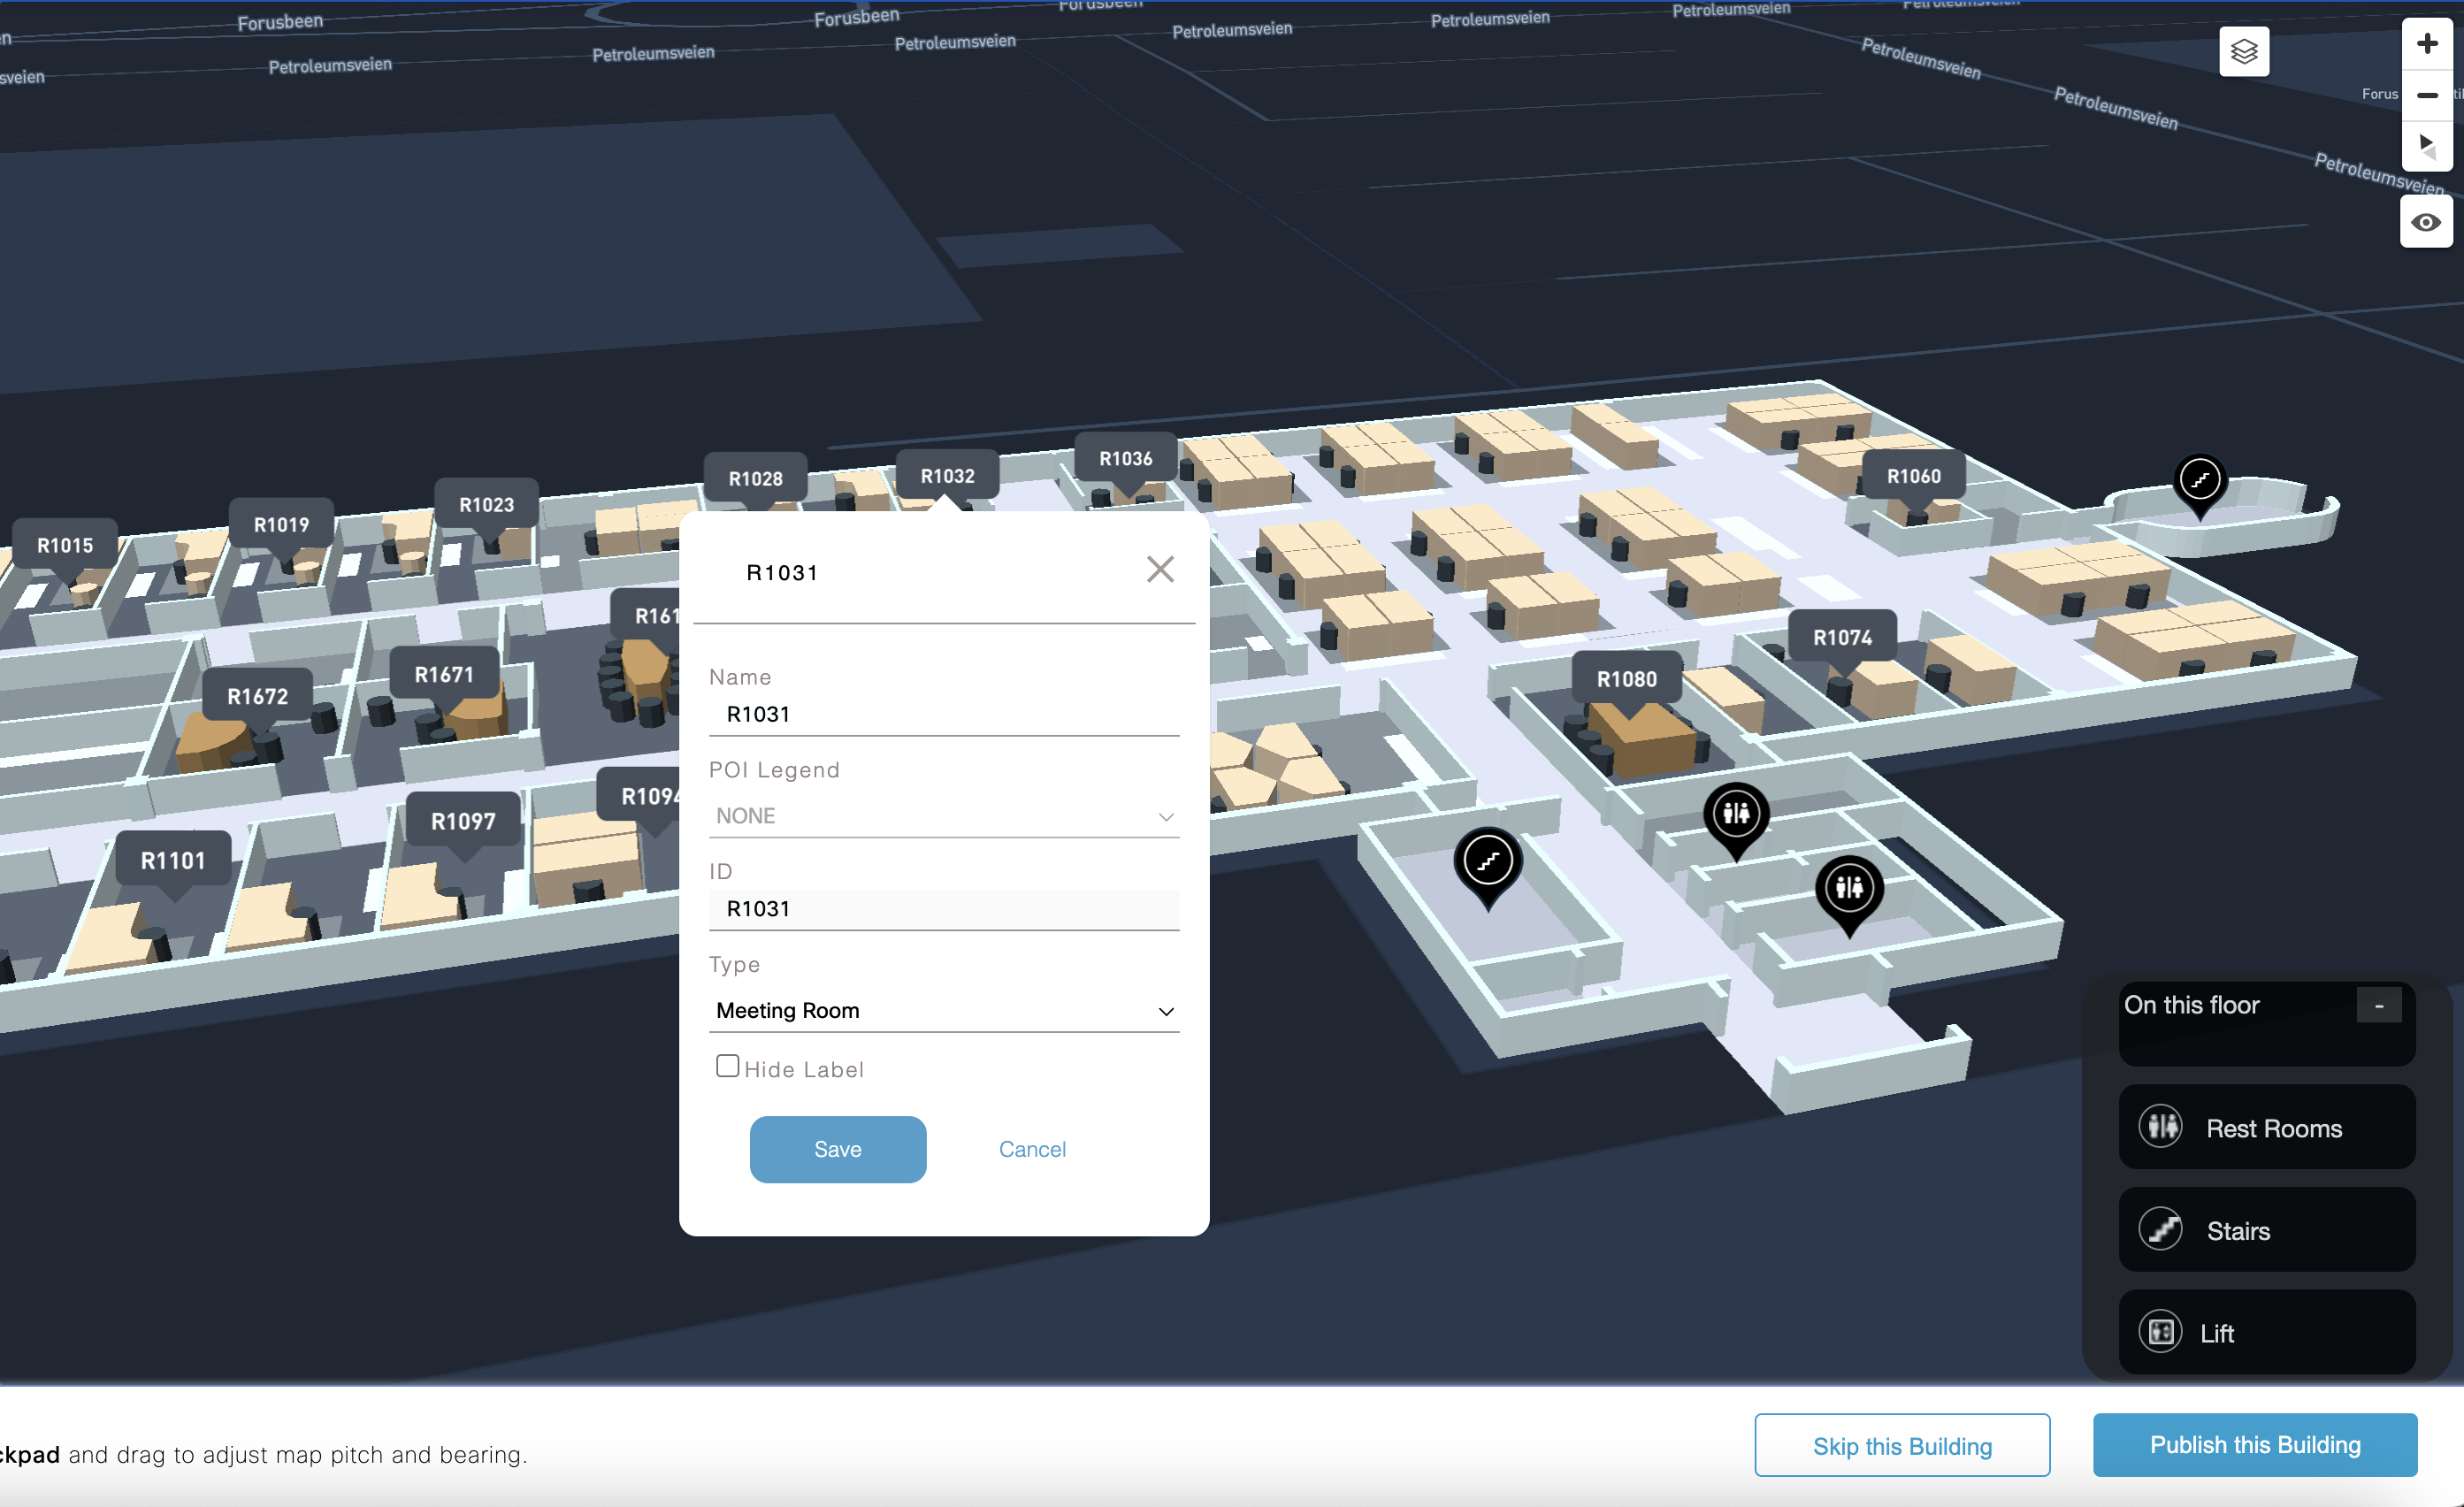
Navigate to Space Manager > Space Management and select the Location and floor/zone where the Meeting room located and you want to associate the PIR to.
Click on the Meeting room space and should open a pop window on the right side after that as below.
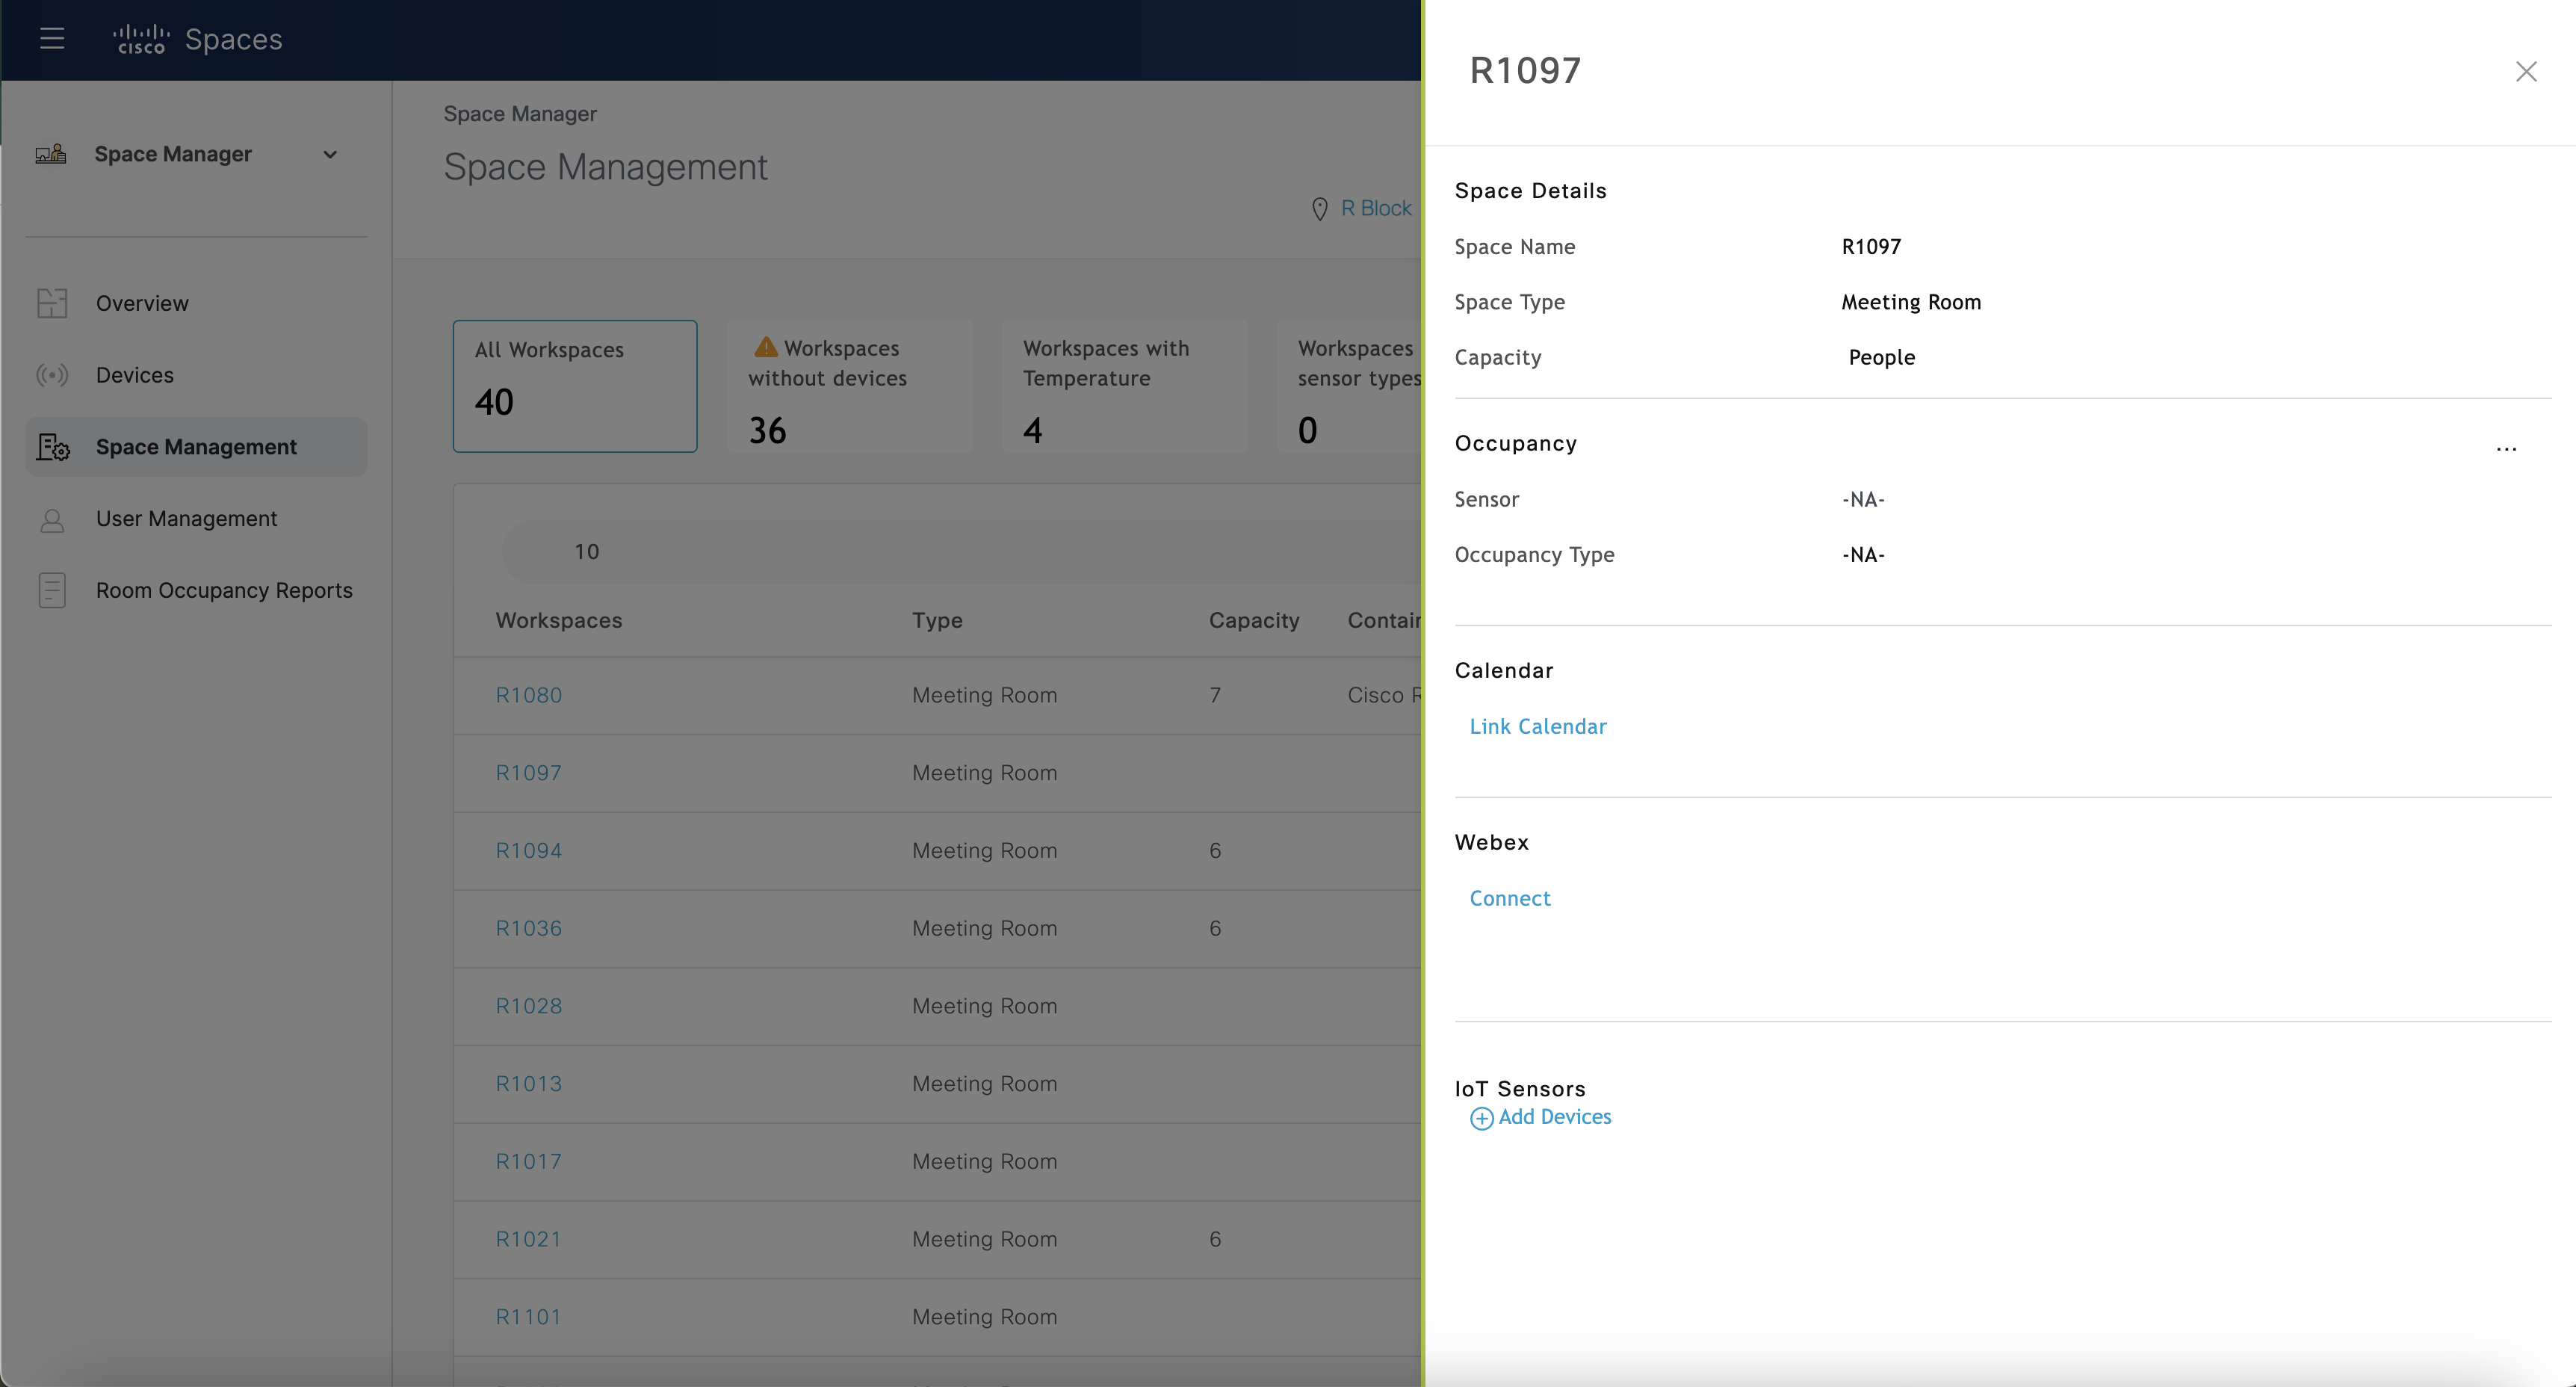
Click on Add Devices under the IOT Sensors associate the Sensor’s mac/BLE mac or uniq ID(device ID) to a Meeting room
Once added it should reflect under the IOT Sensors.
Necessary Step (Short term) :
For room occupancy report to reflect these PIR room info - we need to set occupancy setting for each of this room.
Select edit option for occupancy and save the setting (it will be default People count).
Reason : Space Manager only knows Portal Beams for 3rd Party IoT Sensors for now. Space Manager v2 will account for binary PIR sensors showing correctly there.
Navigate to Space Manager > Overview and PIR reflect immediately there under the Room Occupancy view for the specific “Meeting Room”

Meeting Room should immediately reflect Available status under the Room Occupancy View.
Occupancy is detected within 30 sec , There is 5 min(300 seconds) guard timer to detect if it’s not occupied.
Digital Kiosk Experience
Digital Signage should also reflect the Occupancy Room occupancy status immediately.
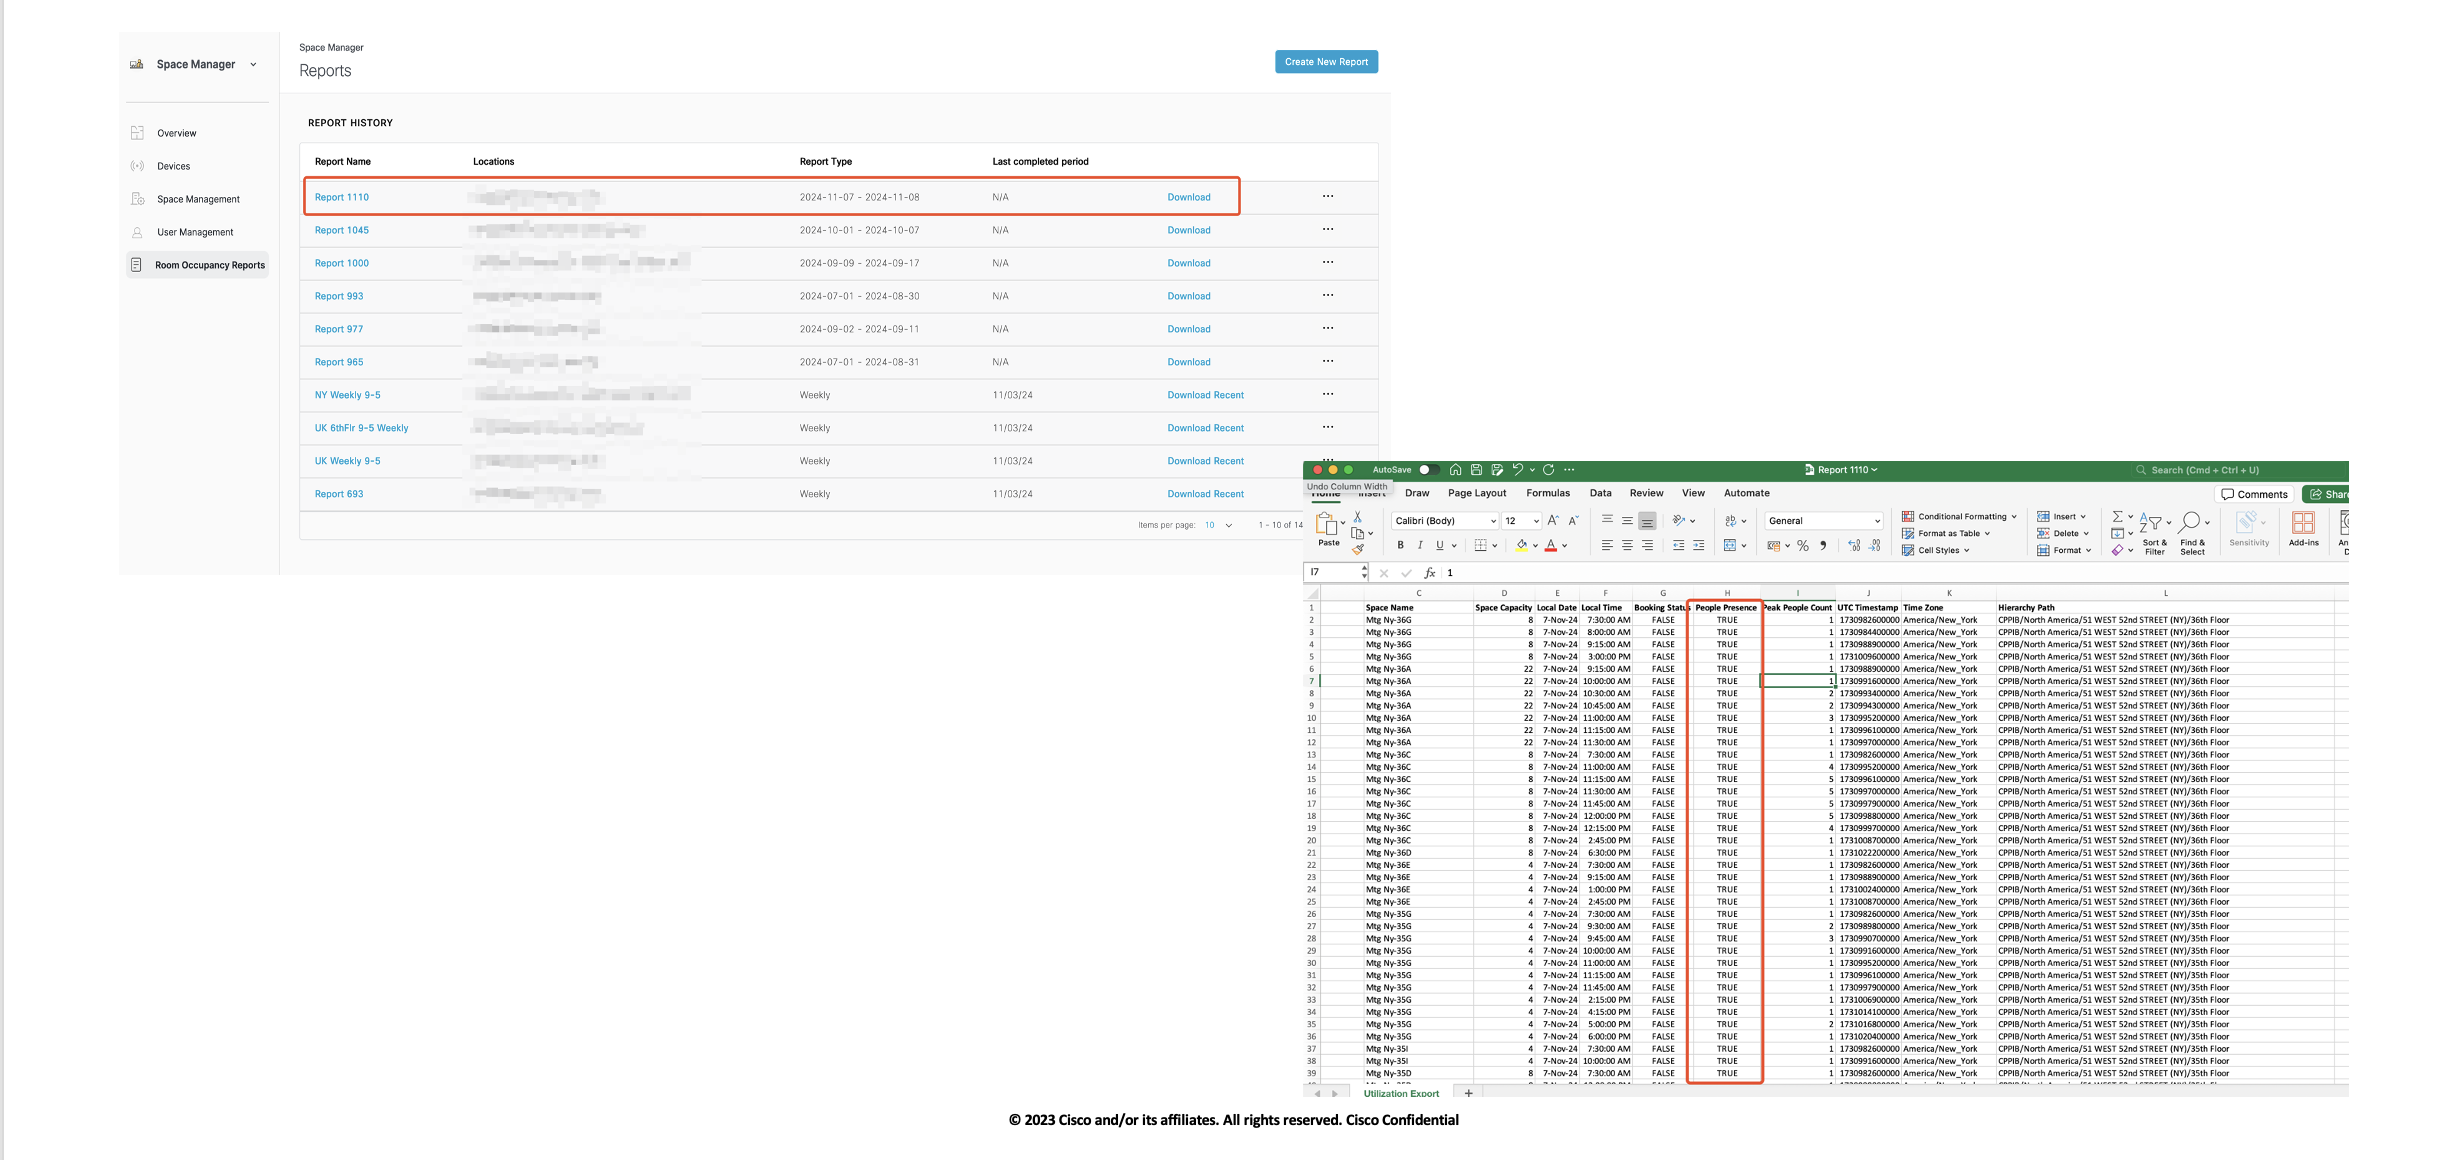
Room Occupancy Reports
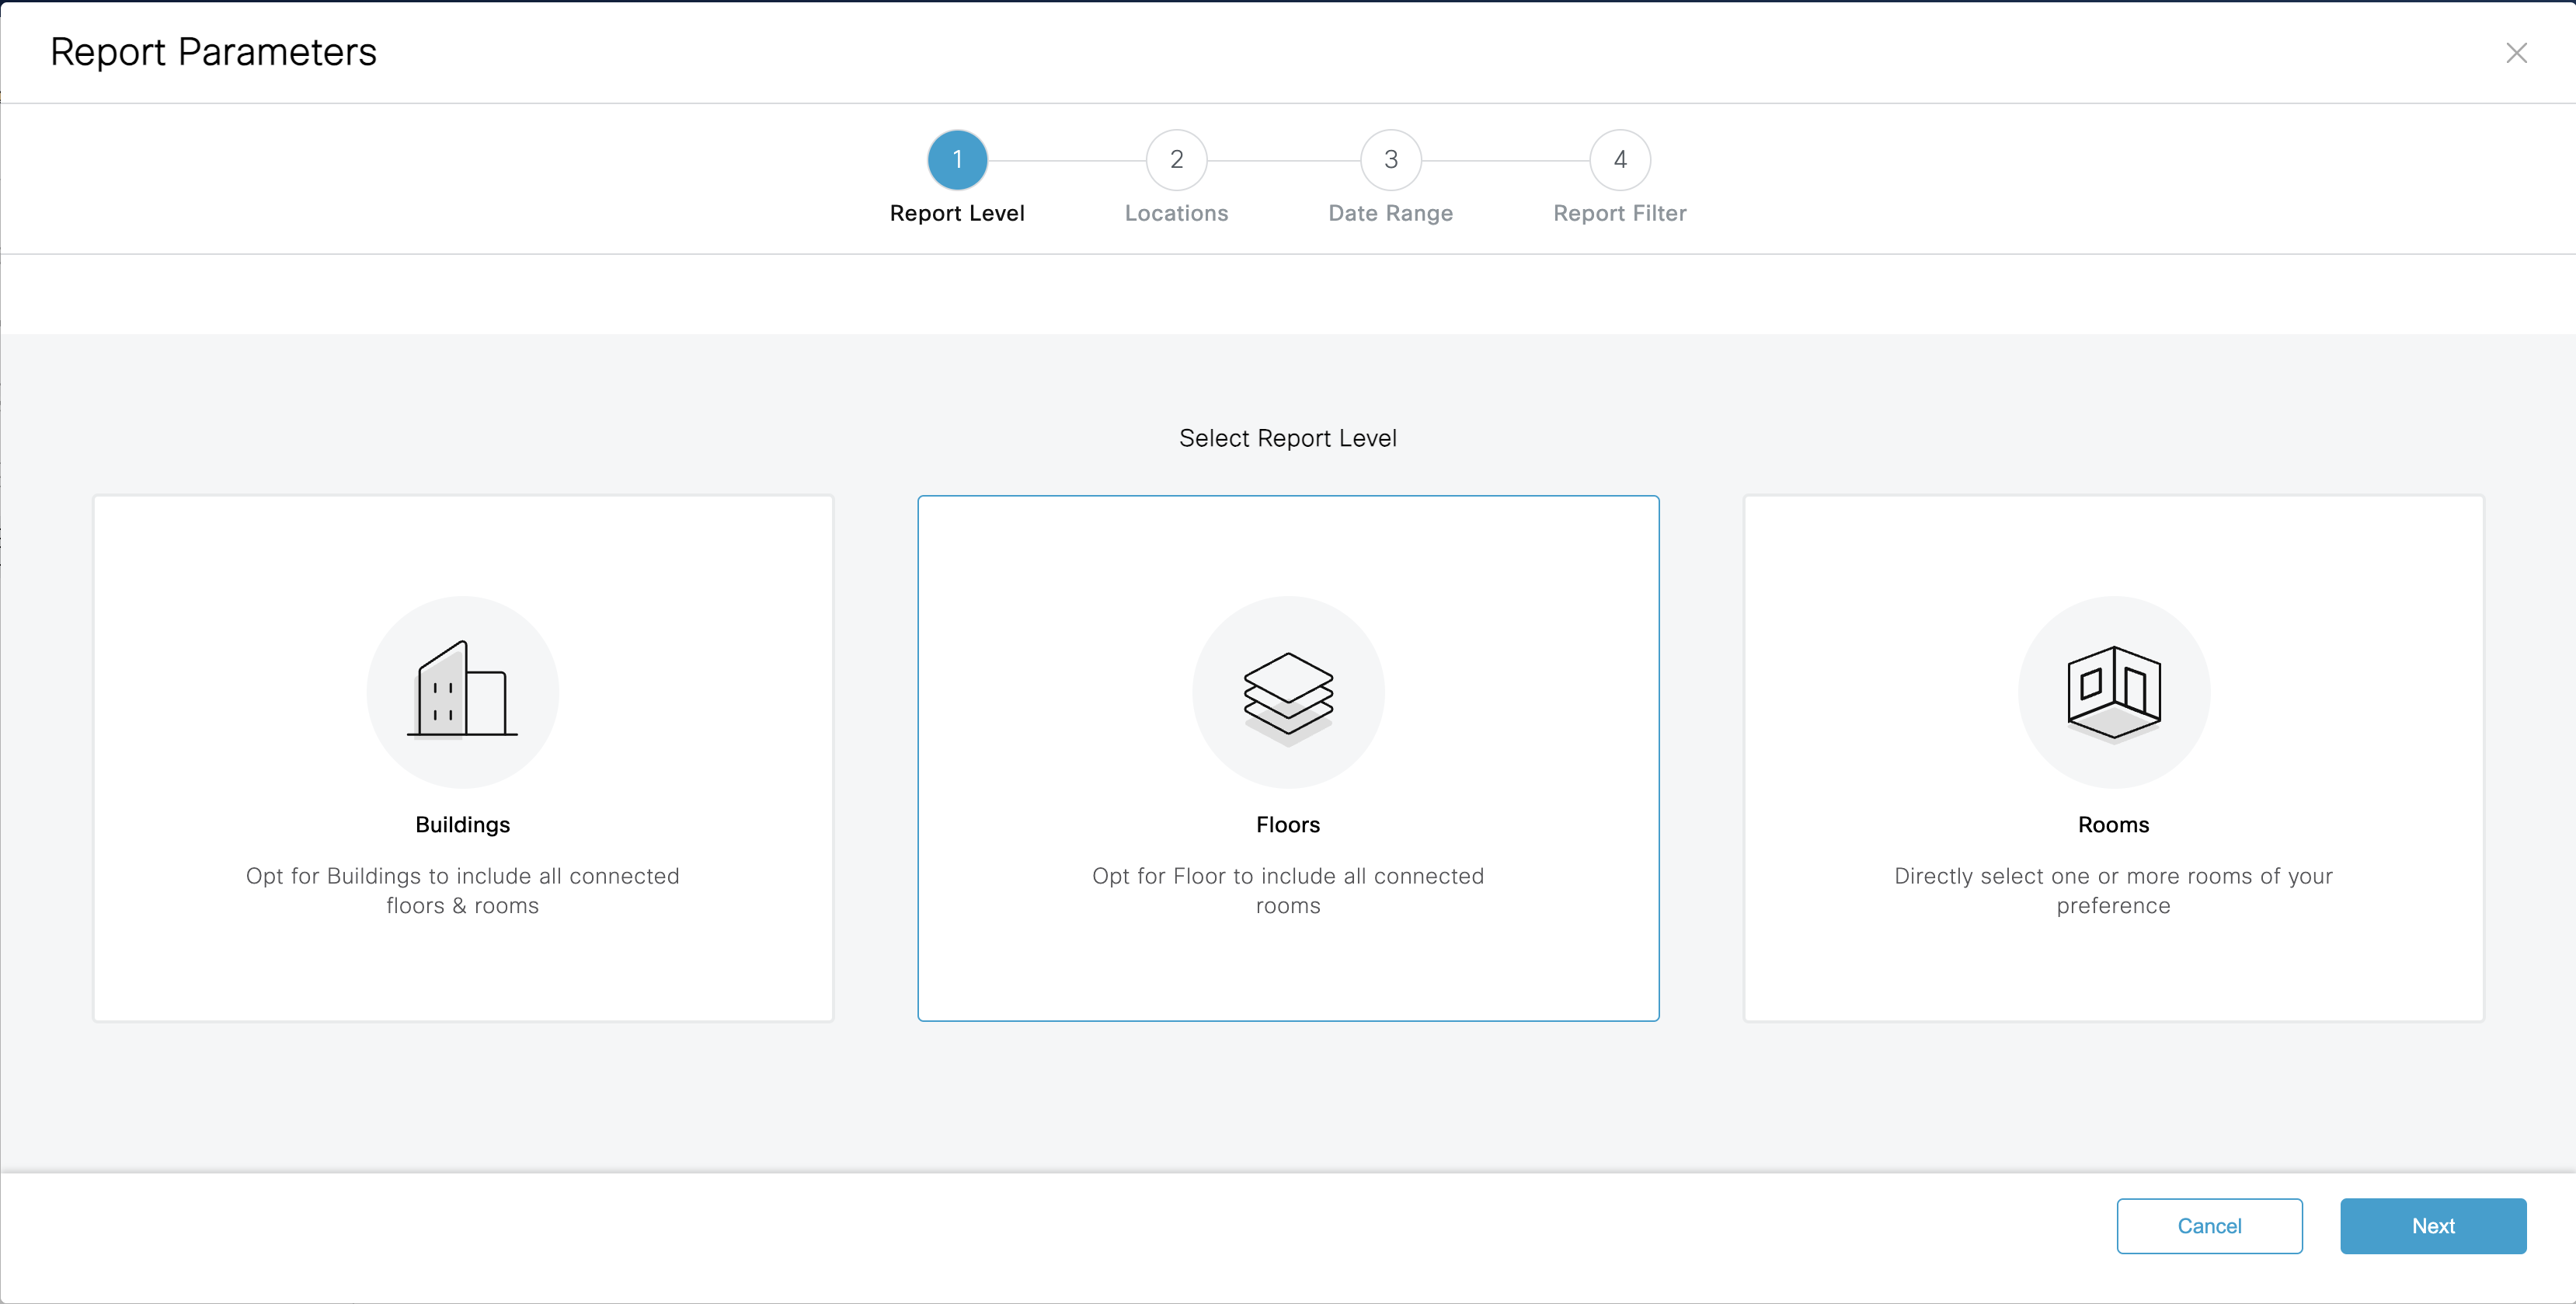
You can Generate Occupancy reports Under Space Manager > Room Occupancy report for Buildings, Floors and rooms.
Click on Create a Report and select Buildings, Floors or Rooms.
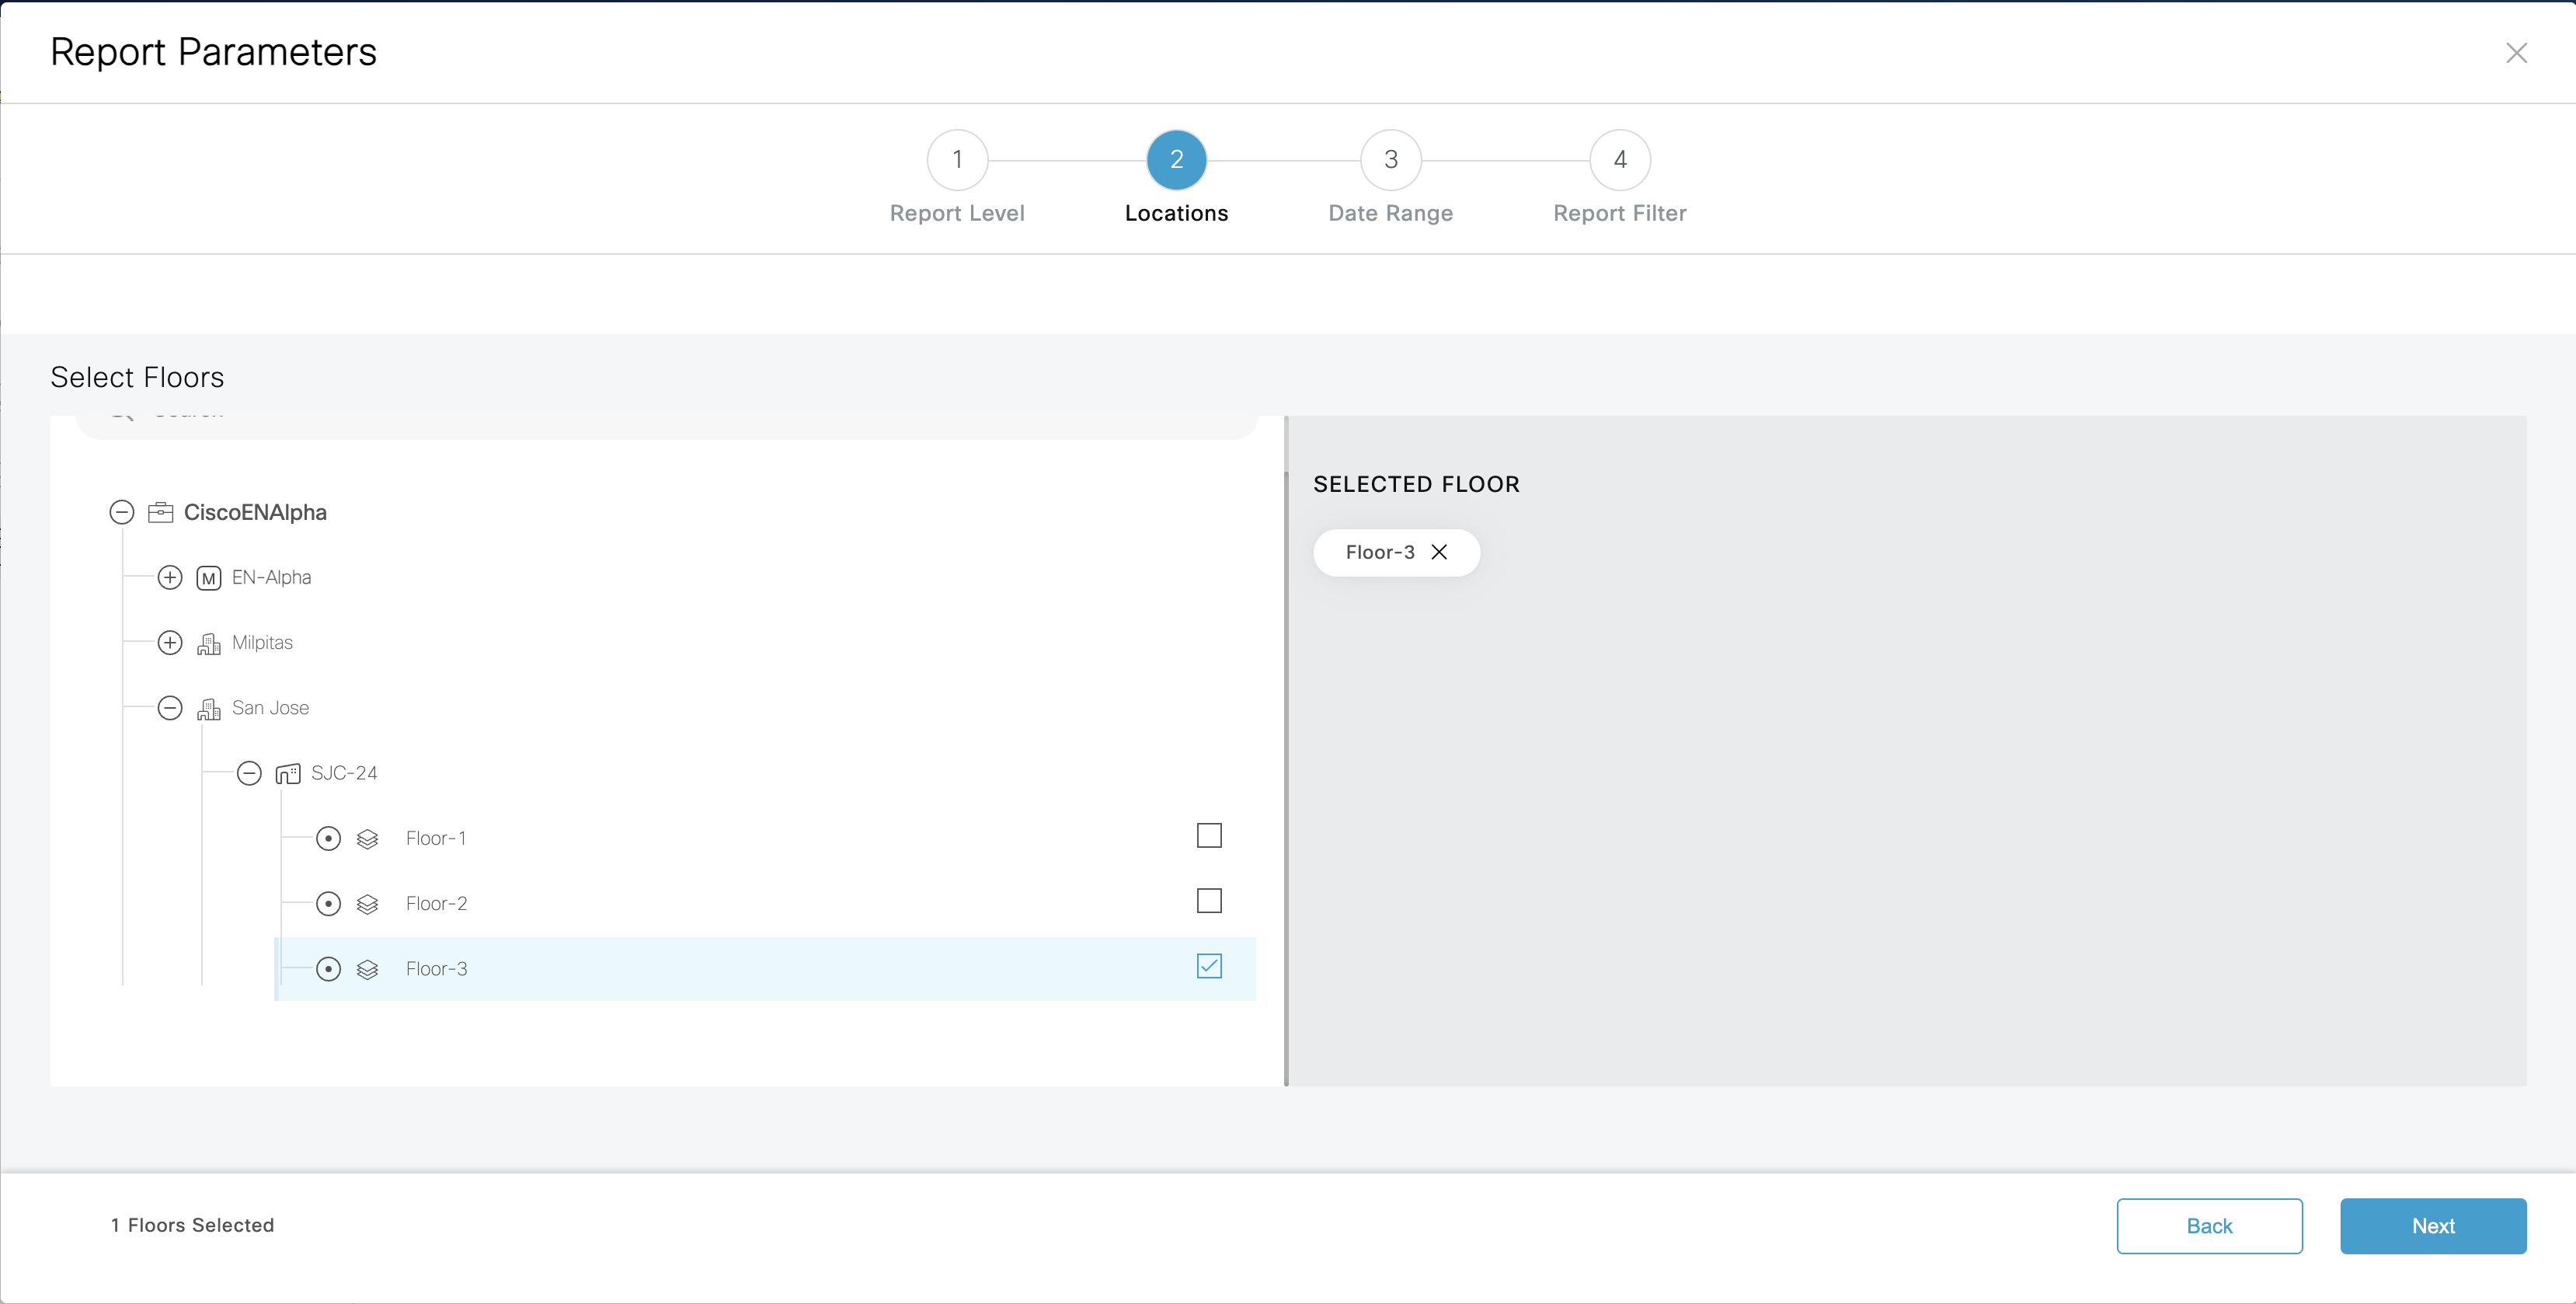
Select a specific Location which will be shown from the Location Hierarchy and Click Next.
Select the Date range or can also Customize it as shown below.
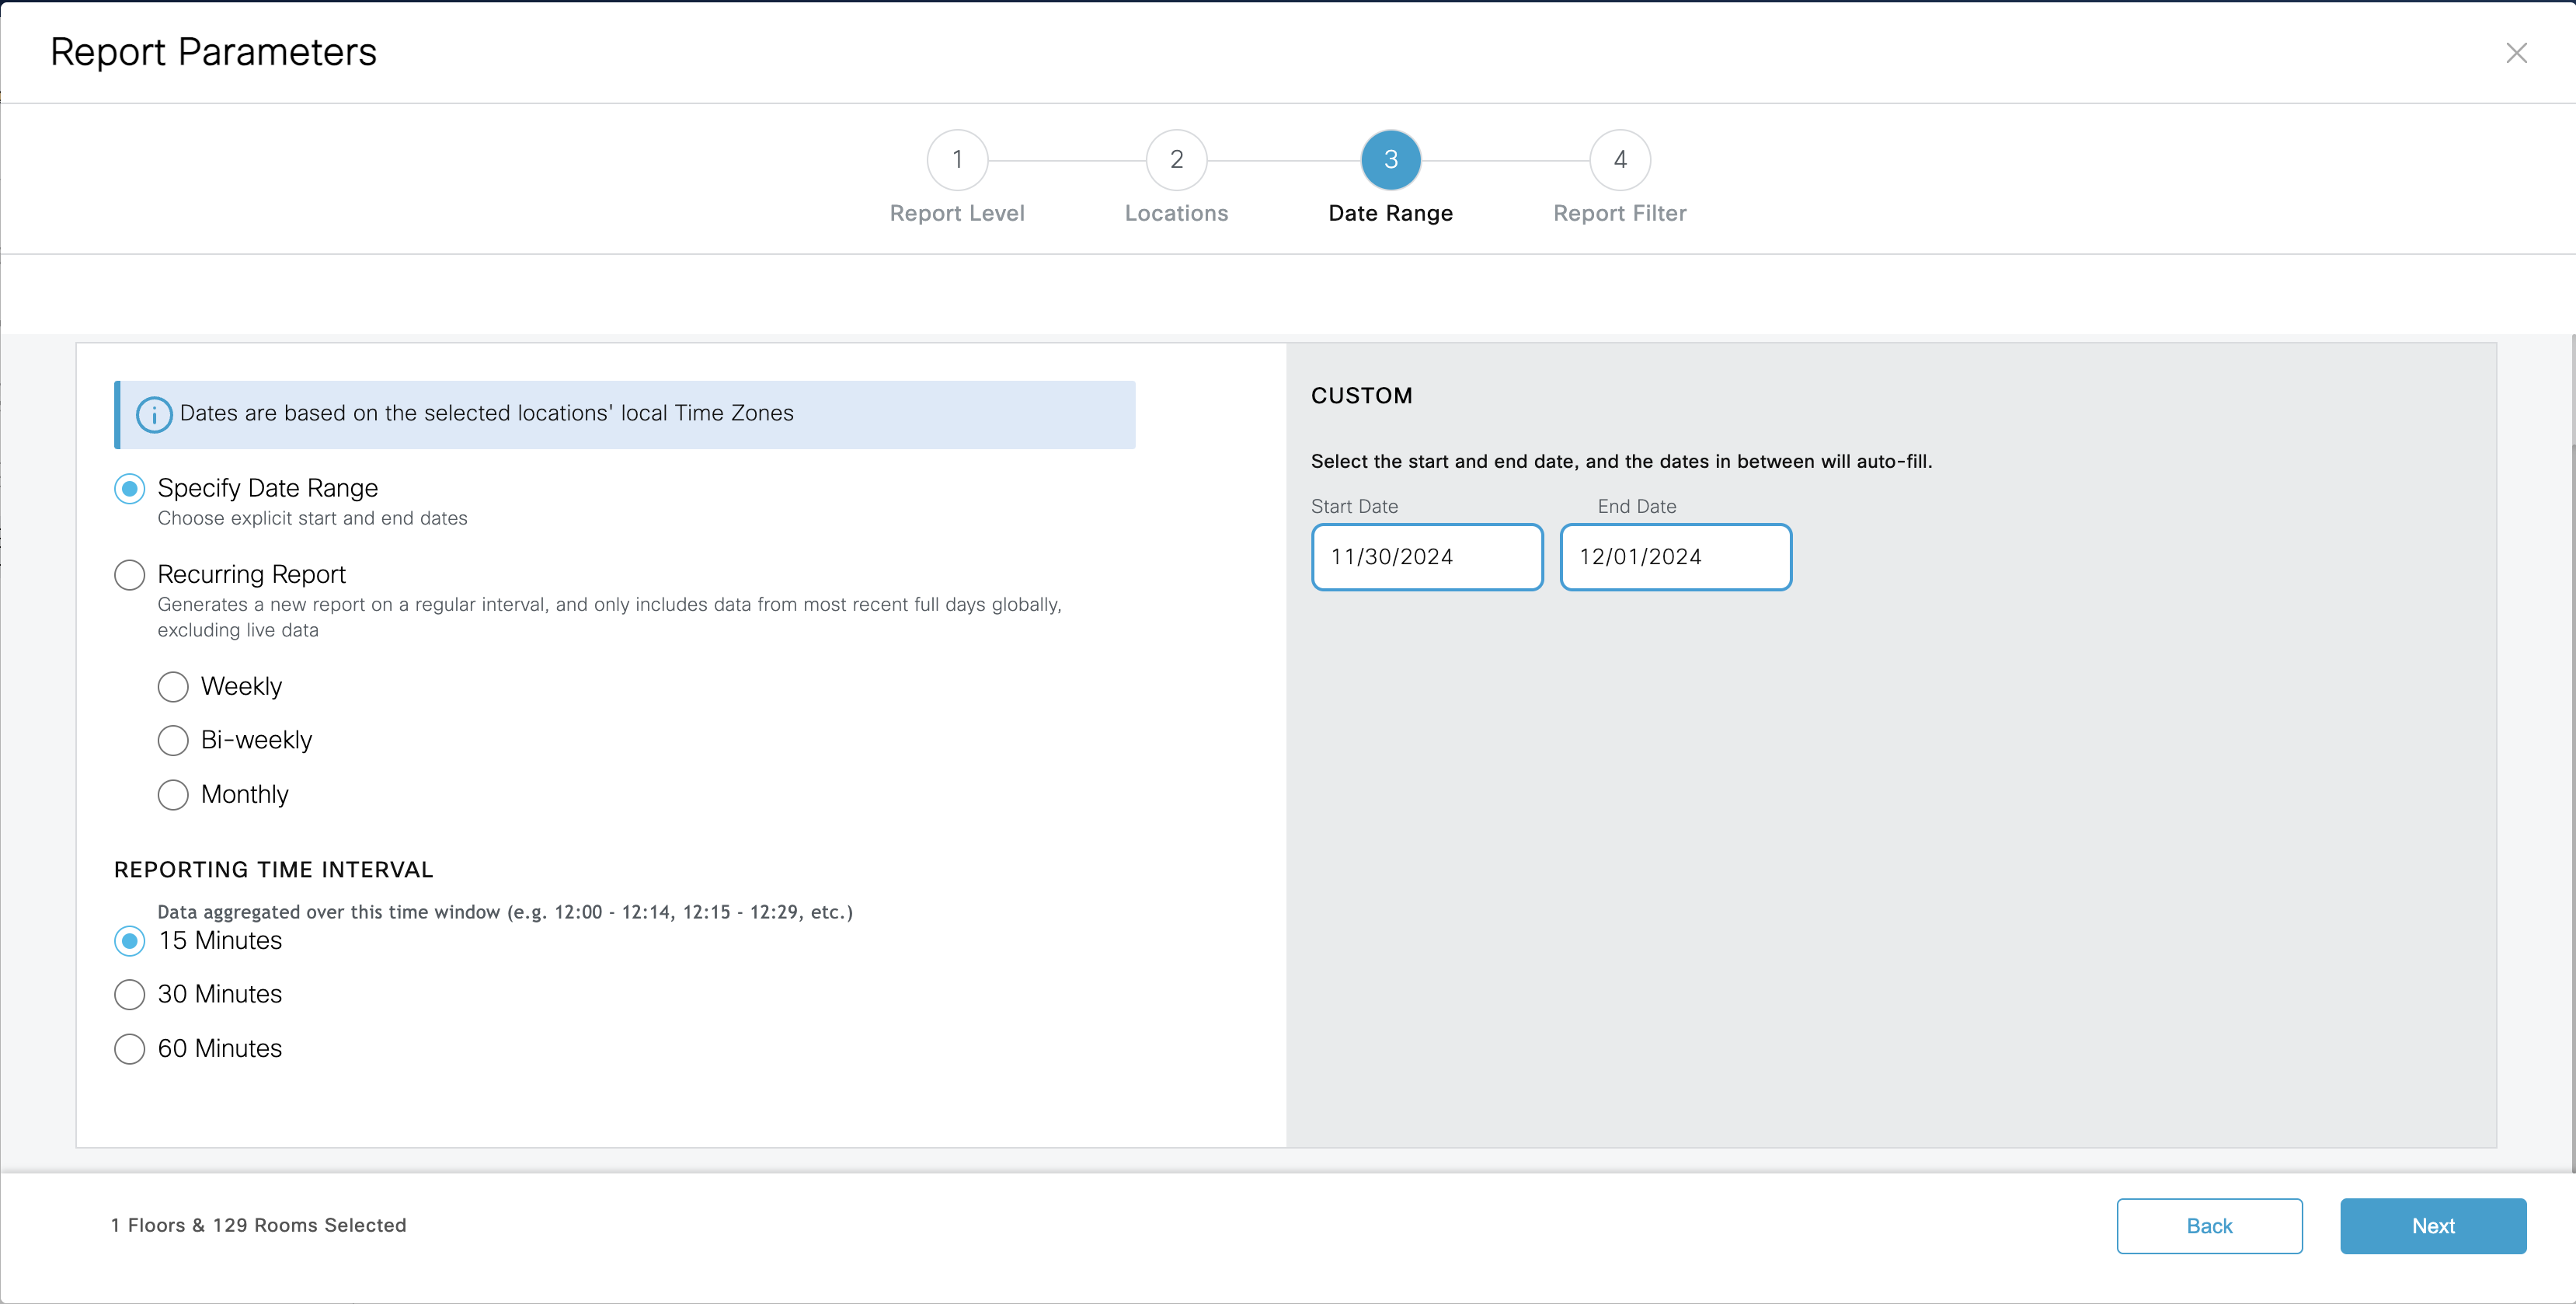
You can be as specific as for Days, hours and capacity of rooms and click on create report.
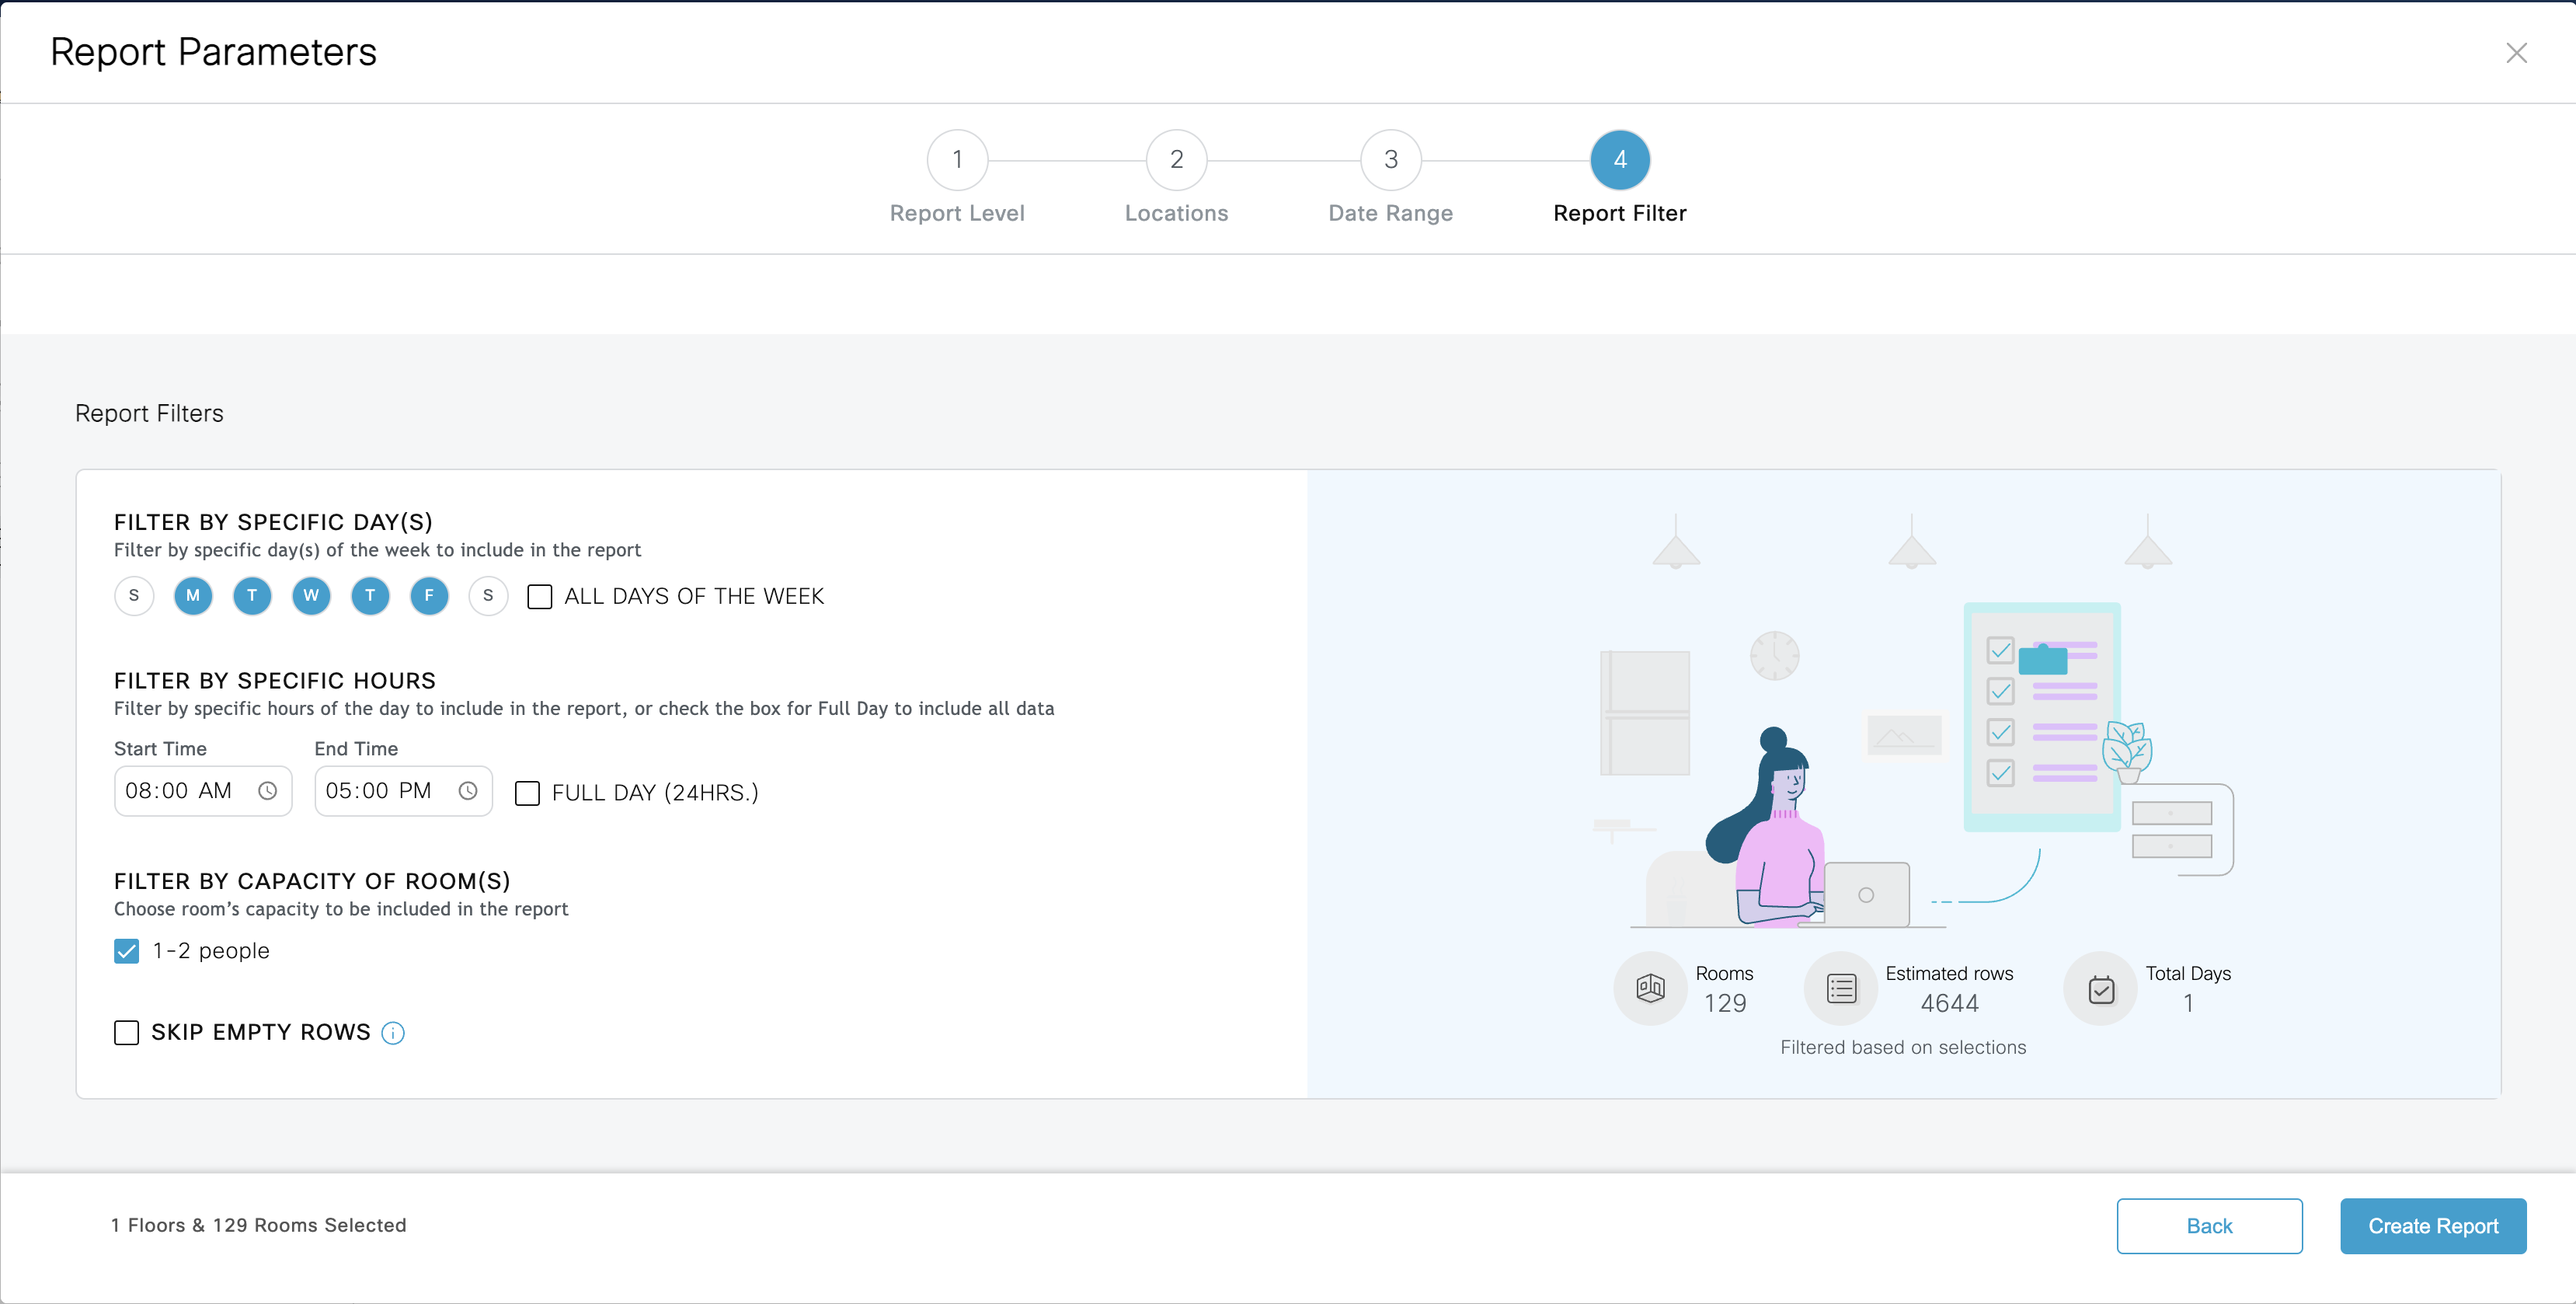
Report layout would like this and can also be exported in .CSV formate to further review and share.
Observations and troubleshooting
Missing location for claimed sensors in IOT services. This blocked sensor to be seen and associated in space manager to any room and not usable for occupancy use case through space manager.
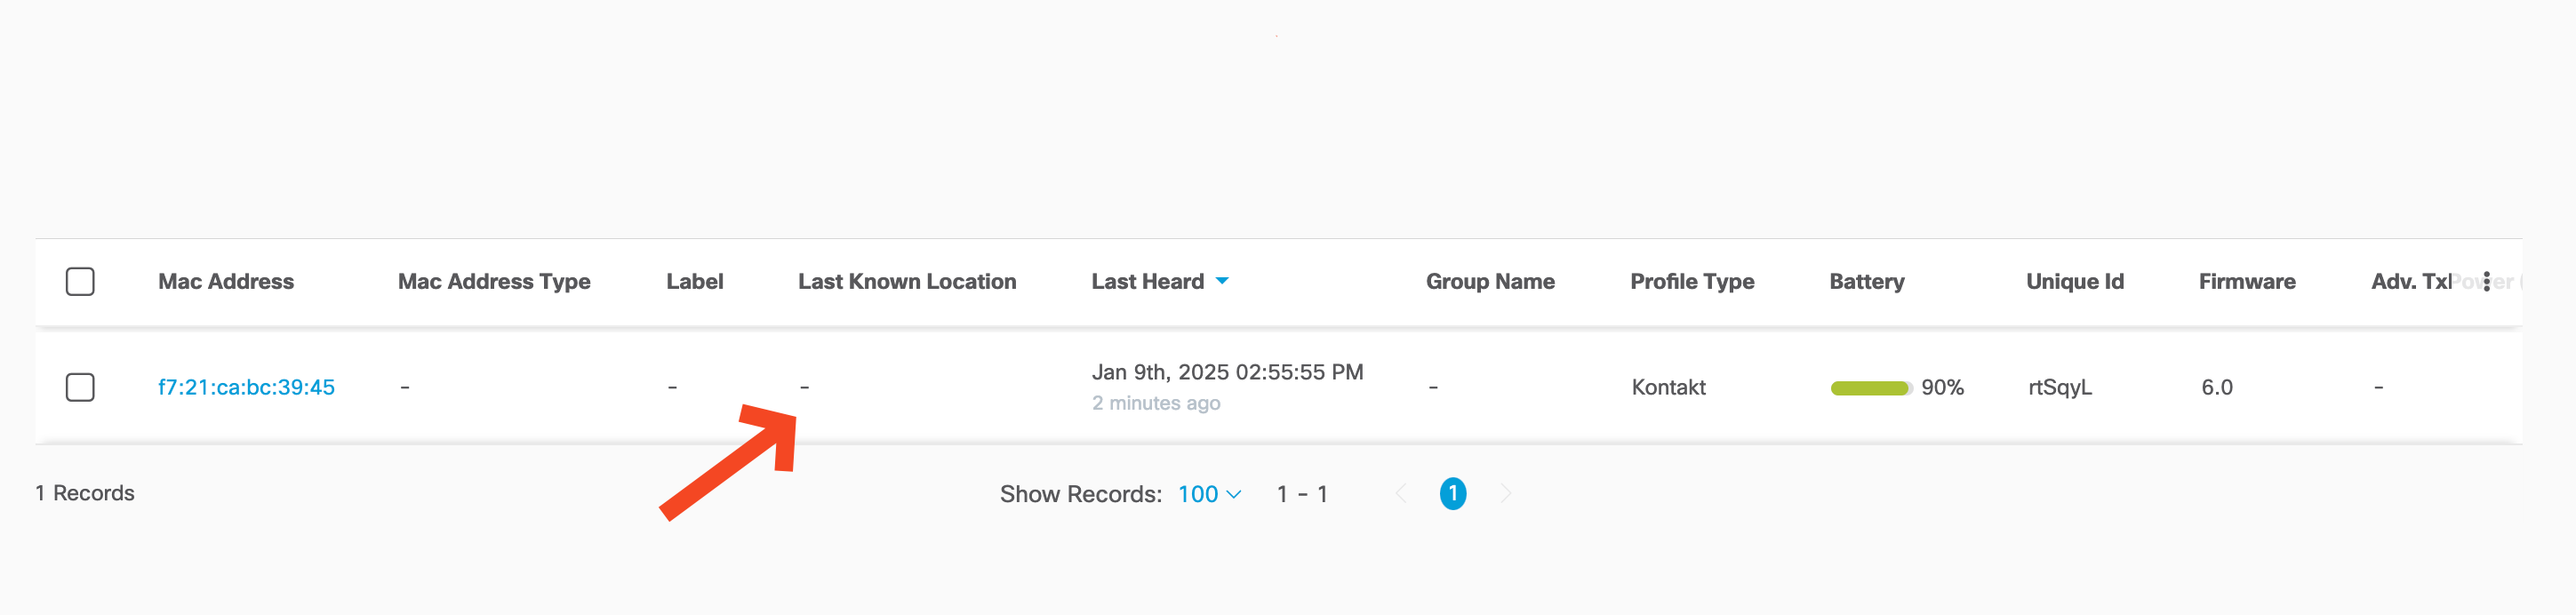
Workaround : Delete the the sensor from IOT services multiple times if needed (until it updates the location under the IOT services)
You need to select the Mac Addresses which are not updating last known location. Under the actions use Delete Beacons to delete that.
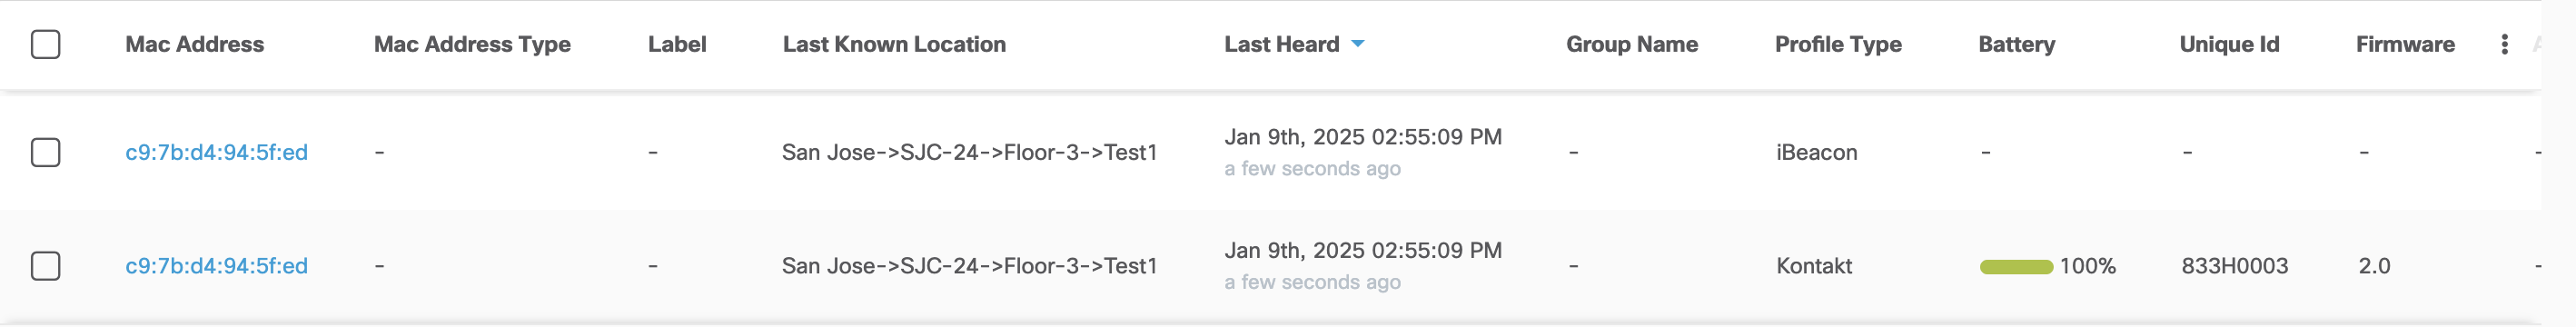
Seeing dual Profile types IBeacon and Kontakt under the IOT Services
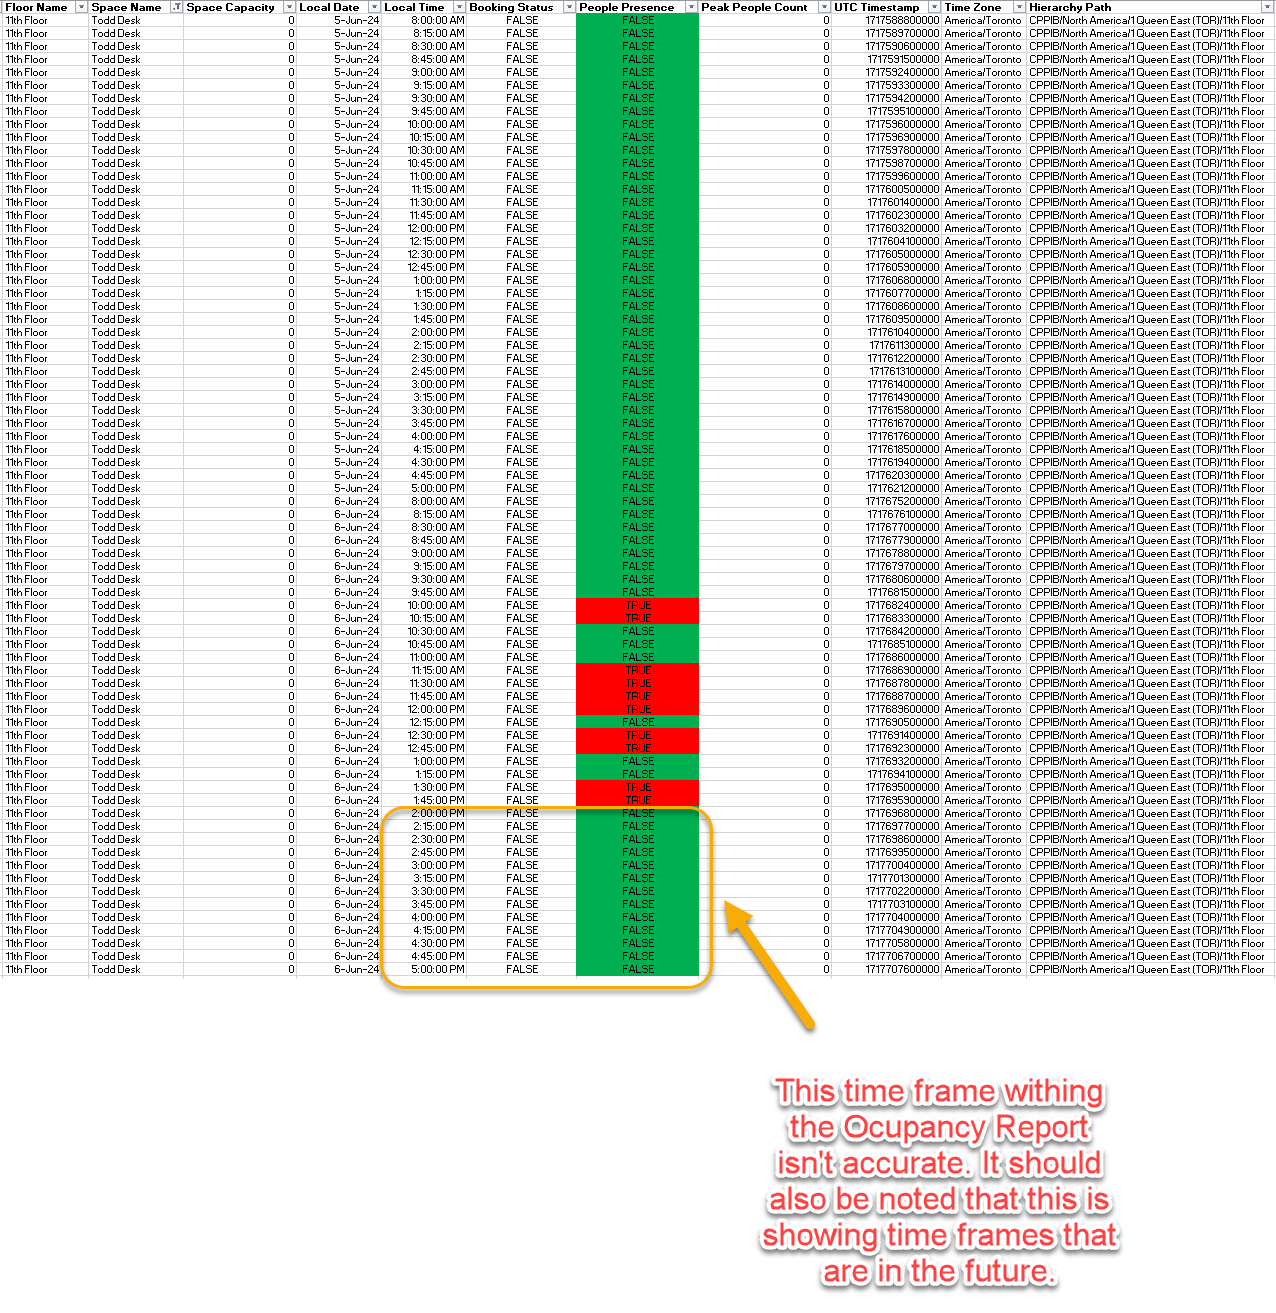
Room occupancy report runs in 4 hour intervals. (Recent update : Resolved but please reach out to Spaces support if the issue reappears )
Workaround : if customer runs report which included current day - then report includes last 4 hours but it shows incorrect data for those last 4 hours (as FALSE) as data is still not processed. We should either avoid prodding last 4 hours or have different status/value for those hours to avoid confusion or have this 4 hour consideration shown as info to customer.
Room Occupancy Report Interval : Room occupancy report calculation for 15 min slot does not sync with WebEx calculation. Currently presence in 8 to 8:15 window reflect into 8:00 slot rather than 8:15 like Webex report. ( Expected )
The Space will be identified as Occupied within 30 seconds (Once the person enters the area if the PIR sensor coverage in both Desk and Room scenarios) and once the person leaves the coverage of the PIR sensor it will still reflect as Available after 5 minutes interval (5 minutes/300 seconds guard timer).The Guard timer should also reflect on Occupancy report as Presence “True“.
"Peak People Count" Column : Room Occupancy report should have N/A entry to Peak People Count , currently it reflect "0" (tentatively expected)
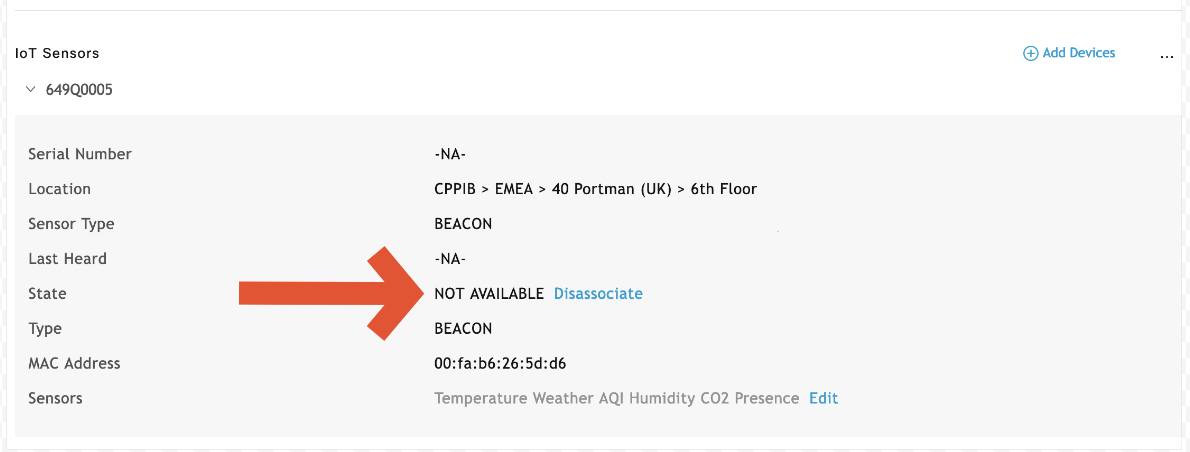
Space Manager: after adding the IOT device with a meeting room the state is seen as “NOT AVAILABLE” even Sensor has been associated successfully and showing status on overview and room occupancy
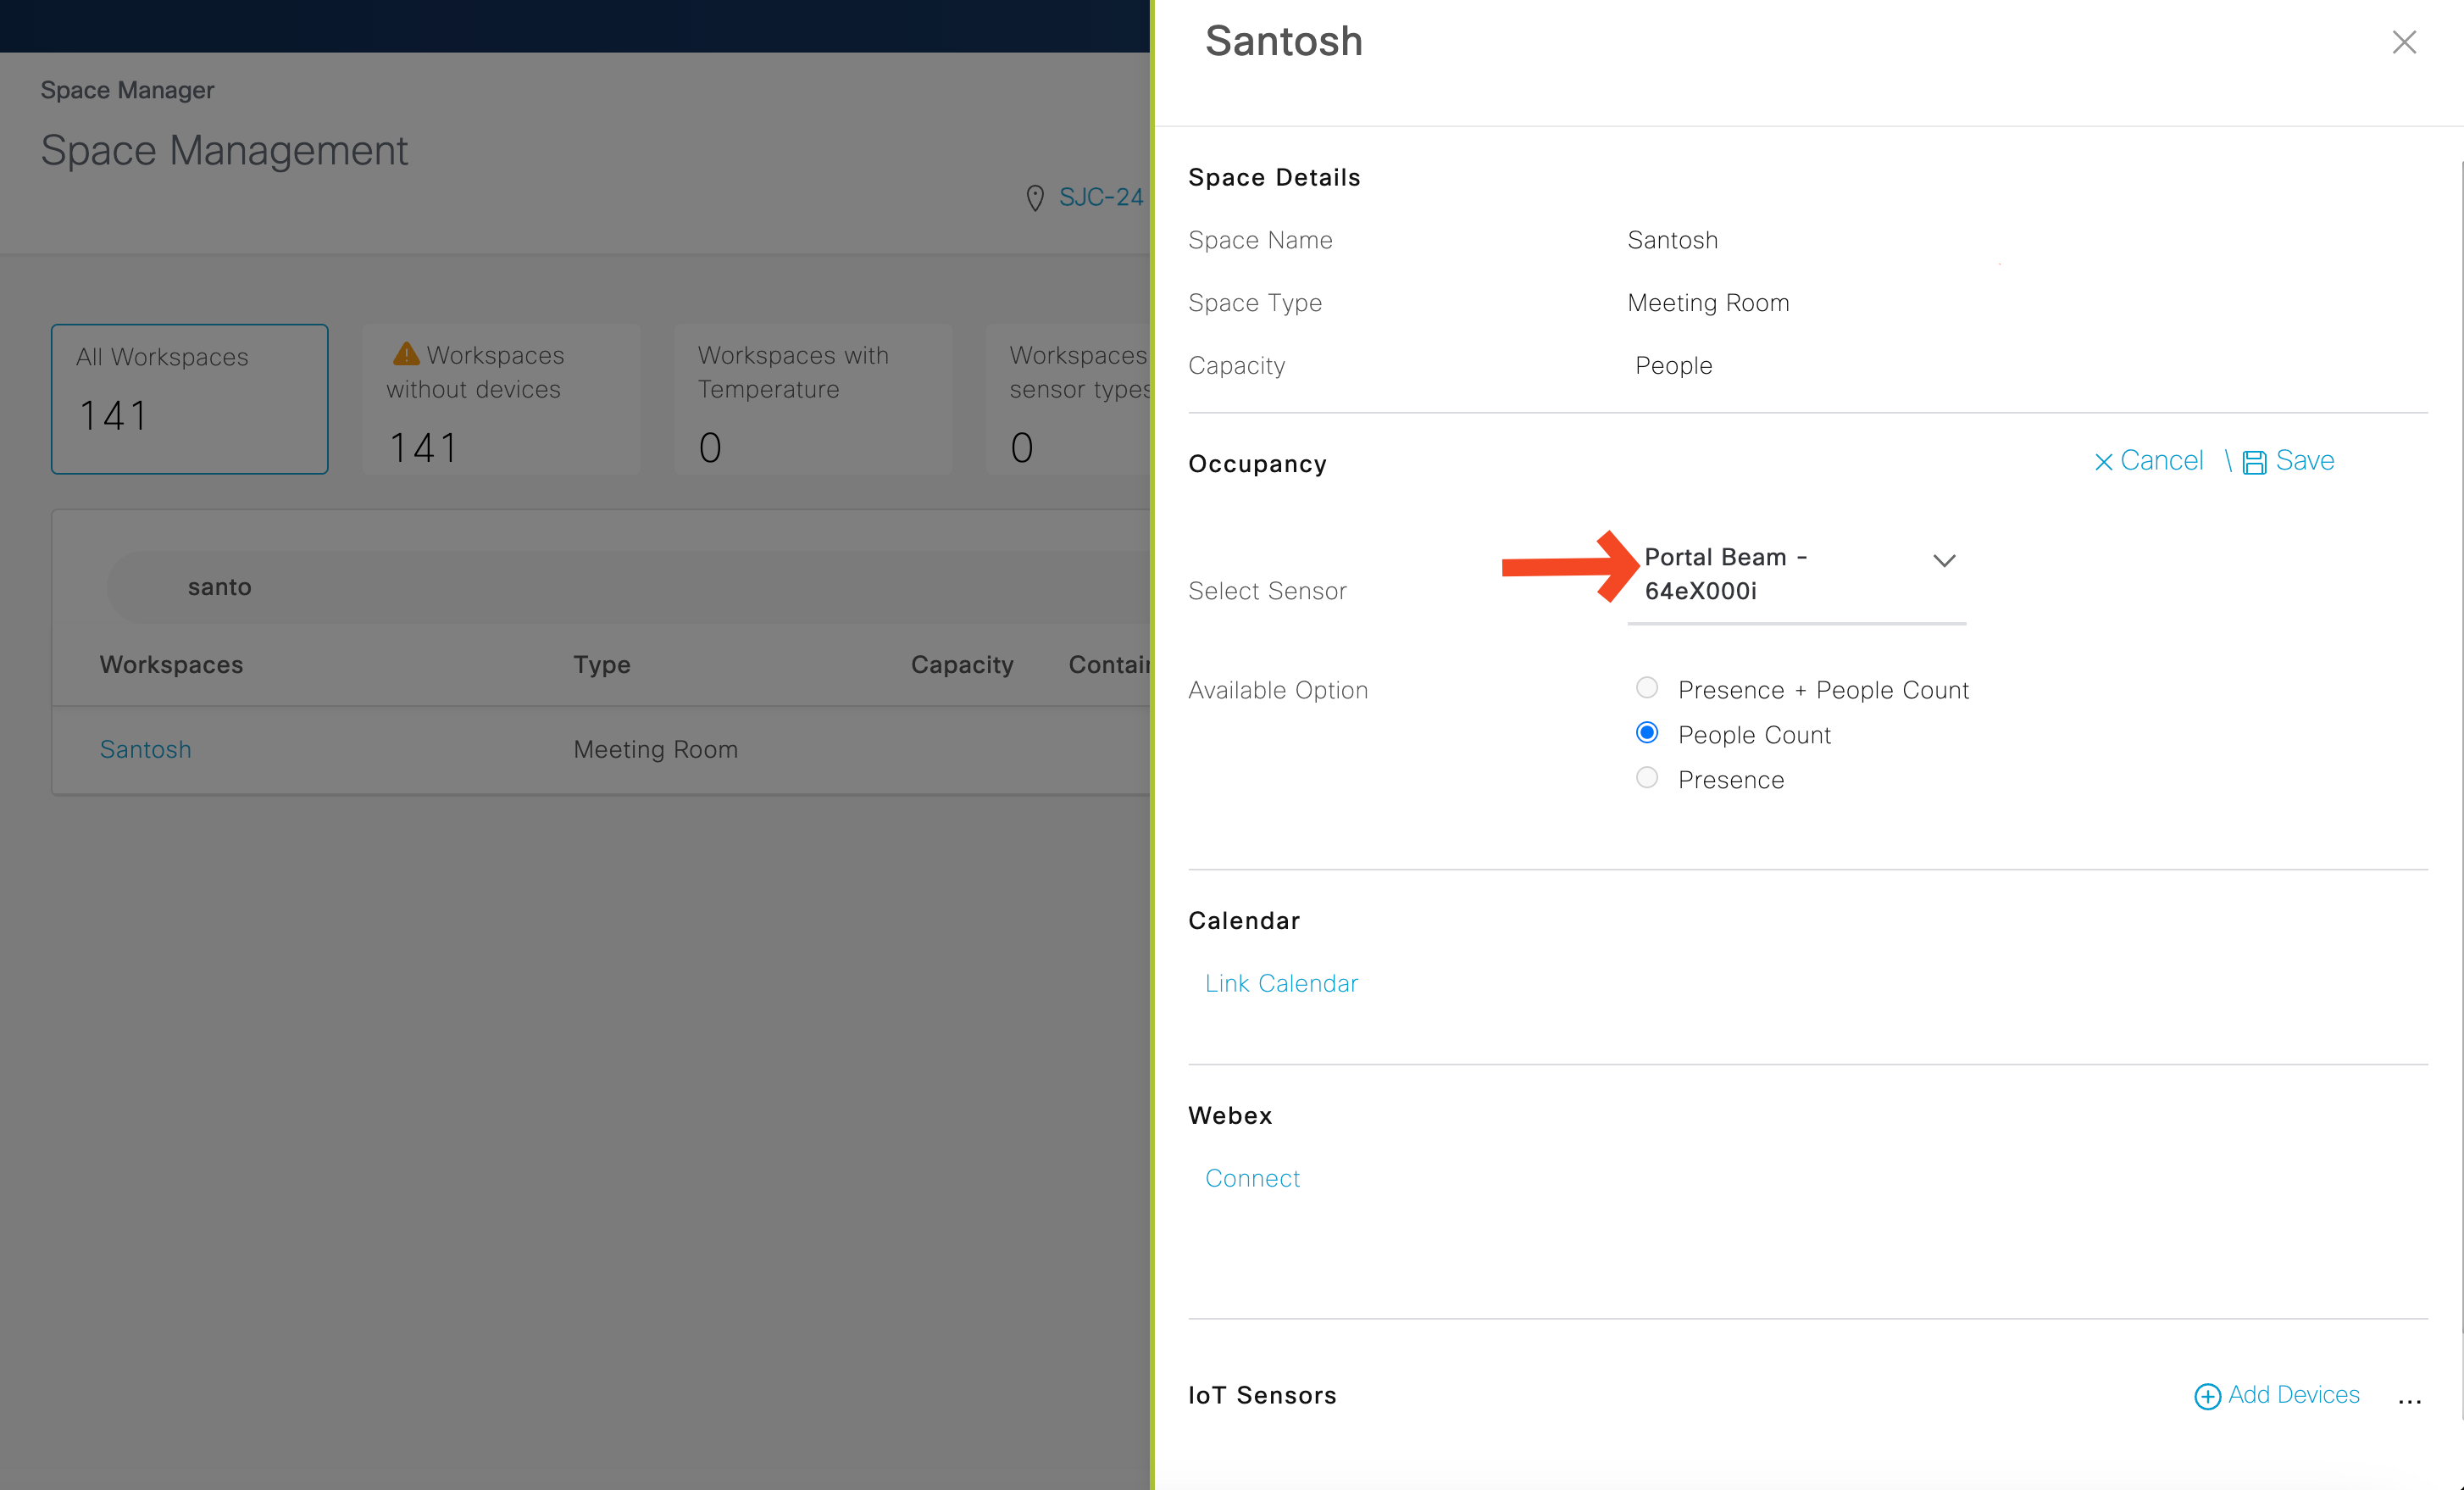
Occupancy selection under space manager for PIR sensor: to set PIR as default occupancy device (needed for room occupancy report) while associating PIR sensor to the room , Currently UI only show portal beam option only. It is expected that Space Manager v2 should fix the issue.
Increase in Power level will impact the battery life of the PIR sensors.
Desk
Overview
Currently there are no GA outcomes for Desk Occupancy
CAVEATS & TIPS
Location Hierarchy
Merging Locations
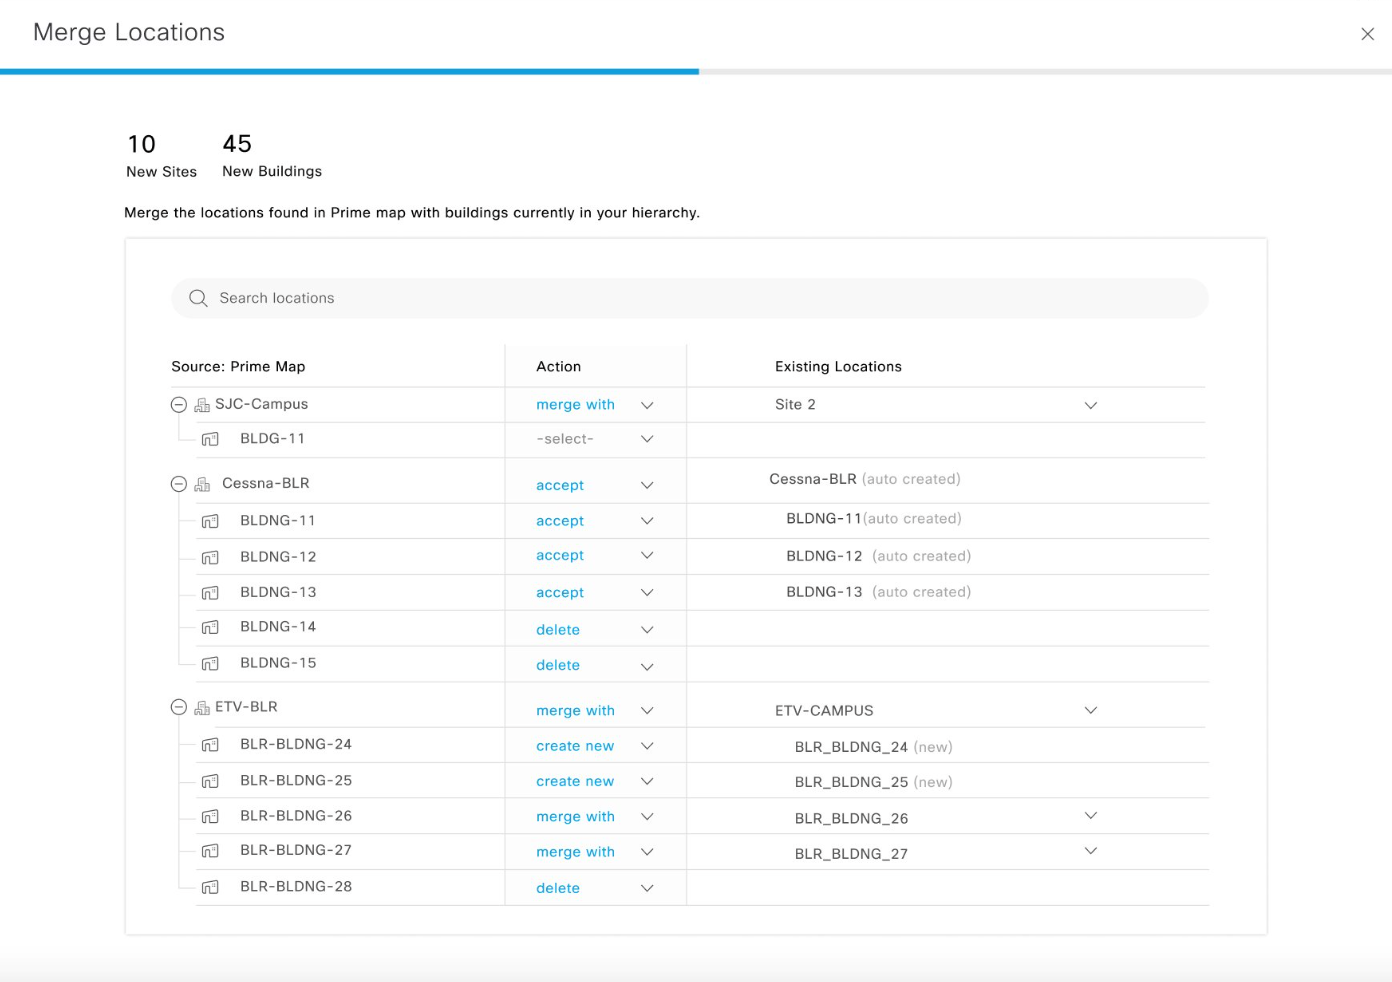
Location Hierarchy merging elements together
Combining multiple hierarchies (e.g. Webex Control Hub and wireless network) adds complexity
The merge function de-duplicates locations so that multiple platforms can be combined into a simplified, unified hierarchy
For a Meraki Org / Network, always plan to merge the “Org” level above all the “Network” levels, and the network maps as floors.
Keep in mind that Catalyst Center may have more groups/levels than the Spaces Excel template supports (3), so it may be best to merge Catalyst Center and skip the Excel template.
Please reach out to the Cisco Spaces team for more complicated merges.
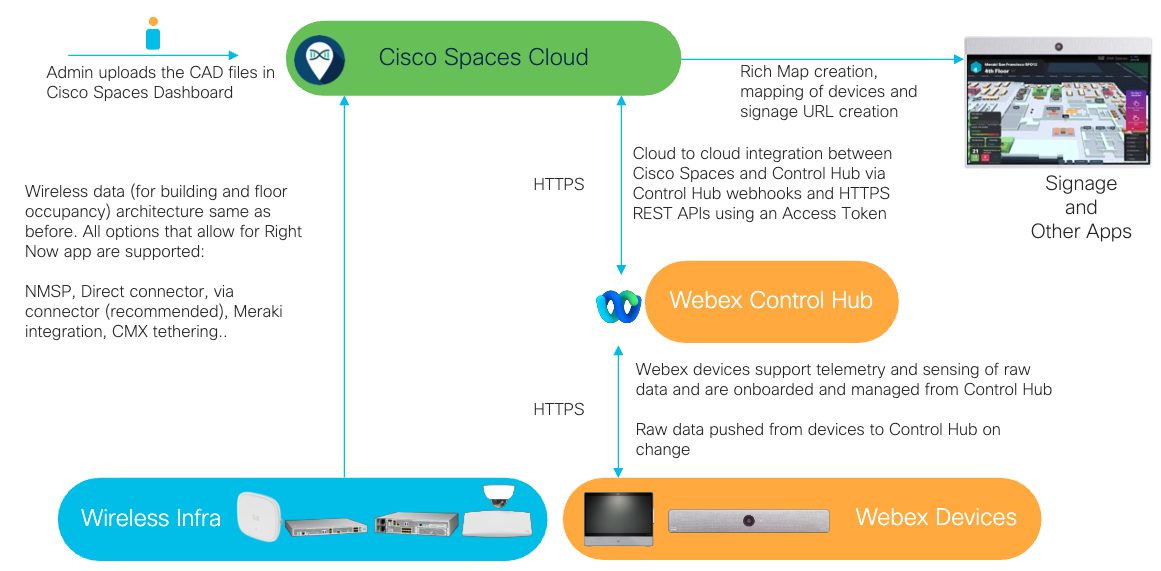
Cisco Collaboration Integration
Collaboration Devices + Control Hub
Webex Devices send telemetry (e.g. people count, temperature, humidity, etc.) on changes to sensor values
Control Hub metadata syncs every ~2 hours (e.g. room capacity, moving location / floor)
Occupancy Architecture
How does the end-to-end solution work for occupancy?
Occupancy Outcome Data
Building Floor Occupancy | Room Occupancy |
|---|---|
Signage | |
Streaming API Firehose | |
Batch/CSV Exports | Room Occupancy Downloads |
Right Now |
|
Behavior Metrics |
|